Figure 1.

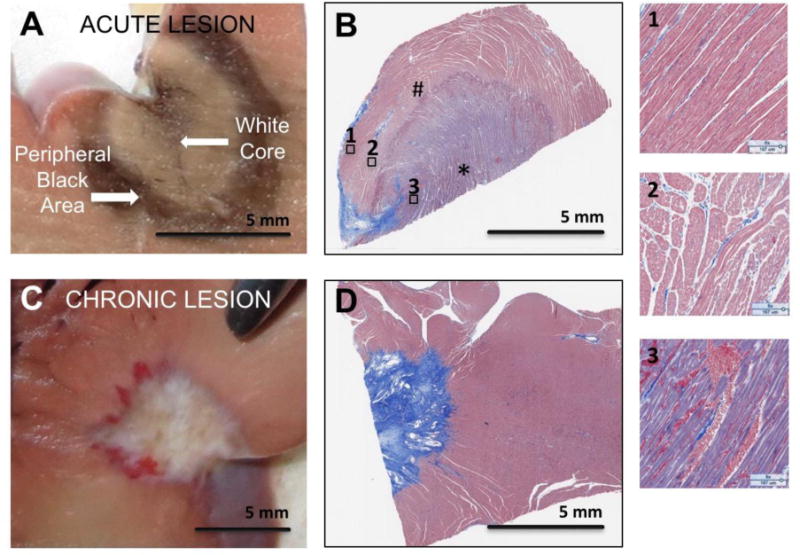
Gross pathology and histology images of acute (panels A and B) and chronic (panels C and D) ablation lesions. Panels B and D are Massons’ Trichrome Stain. Panel A shows the central black and peripheral white area seen in acute lesions starting at the enodocardial surface. Panel B is histology of an acute lesion. Three regions with much higher magnification from Panel B are shown to highlight the tissue changes in the acute lesion going from the core of the lesion (3) to more peripheral areas in 2 and 1. The core area (3) has complete destruction of the myocardial architecture and corresponds to the black area. Area 2 shows increased extracellular space and area 1 has preserved myocardial architecture. Panel C shows a chronic lesion starting at the endocardial border. Panel D shows the dense scar it the chronic lesion with a distinct boundary with normal tissue. The * area is the white core and the # is the surrounding black area.
