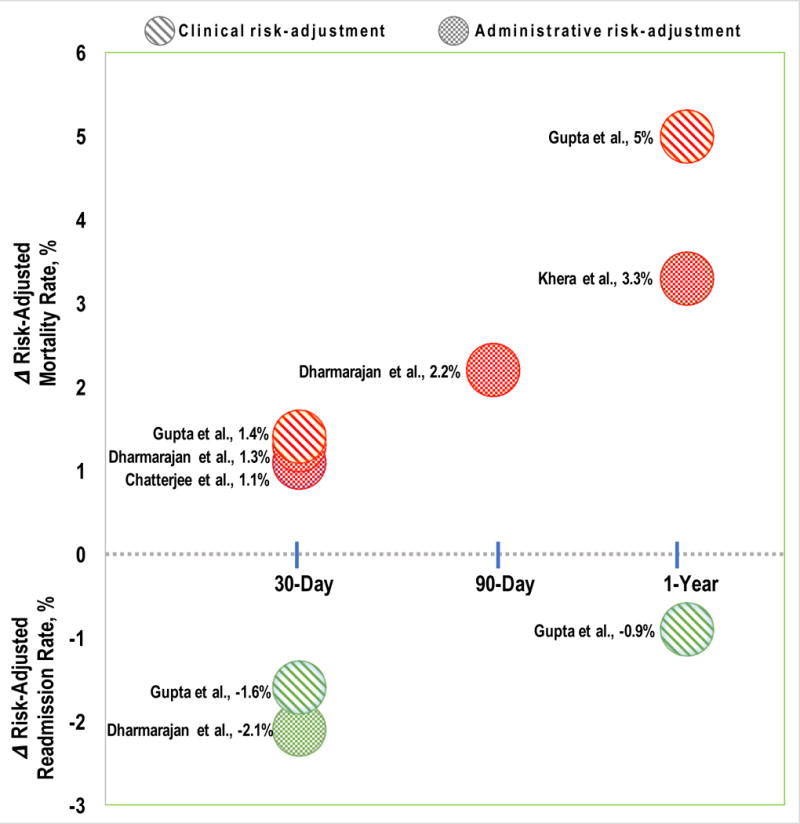
Figure. Absolute change in risk-adjusted heart failure readmission and mortality rates following implementation of the HRRP.

Figure summarizes the estimated absolute changes in 30-day, 90-day, or 1-year risk-adjusted readmissions (green circles) and mortality (red circles) after hospitalization for heart failure post implementation of the HRRP. The study by Gupta et al. (line pattern) used prospective clinical registry data for risk-adjustment. Rest of the studies (check pattern) used administrative (billing codes) data for risk-adjustment. Comparative time periods used in estimation of change in rates were: Chatterjee et al., 2009 to 2015; Dharmarajan et al., 2008 to 2014; Gupta et al., pre-HRRP period (2006-2010) to post-HRRP period (2012-2014); Khera et al., 2010 to 2012.
This figure highlights: 1) The HRRP implementation was associated with a modest reduction in readmissions and an increase in both short-term and long-term mortality after heart failure hospitalization in multiple independent investigations; 2) decline in readmissions was higher and rise in mortality was lower in heart failure post-HRRP in studies with administrative risk-adjustment compared with the study utilizing clinical risk-adjustment, suggesting evidence of upcoding post-HRRP; 3) a significant proportion of reduction in 30-day readmissions was lost at 1-year suggesting some of the readmissions were not prevented but delayed beyond discharge day 30th. HRRP, Hospital Readmissions Reduction Program
