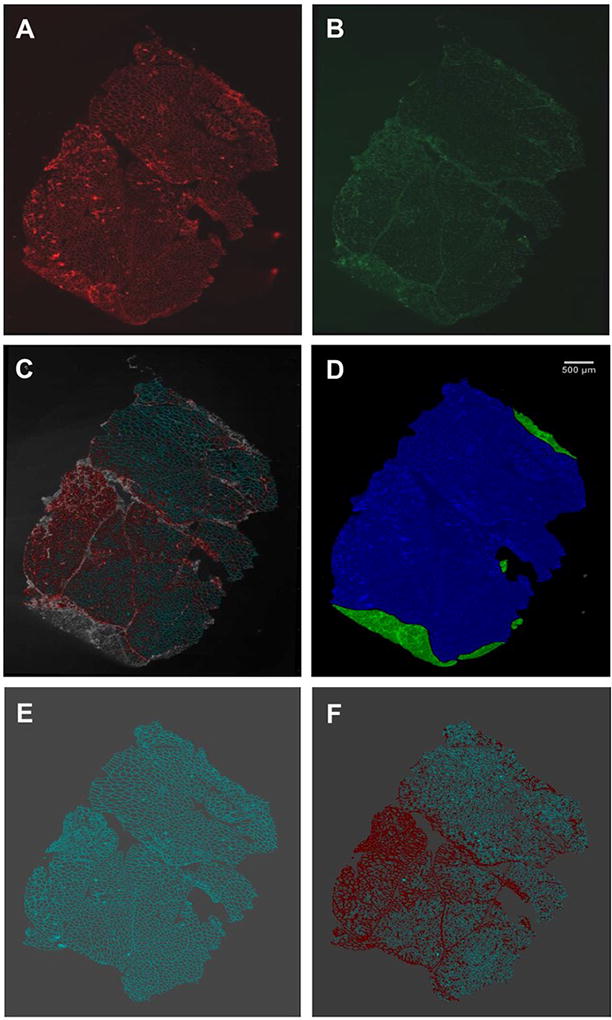
FIGURE 1. Representative Projections of Entire Muscle Section Image Files.

Projections of entire image files of biopsy GNE-M3 are shown to illustrate the fluorescence quantitation process. Biopsy slides were co-stained with membrane marker CAV-3 (secondary antibody AlexaFluor555-labeled) (A) and sialic-acid binding lectin SNA (FITC-labeled) (B). CAV-3/SNA fluorescence overlay image (C). Manual annotation to exclude non-specific areas (green) from analysis (D). Caveolin fluorescence set as a mesh for muscle membrane area (E). SNA fluorescence co-localizing on CAV-3 mesh (F). Fluorescence overlay images of all 9 biopsies are displayed in Supplemental Figure S1.
