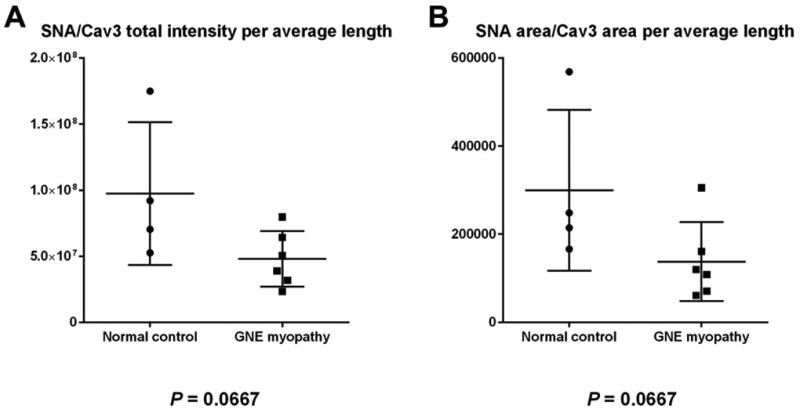
FIGURE 2. Dot Plots of Fluorescence Quantitation Results.

Dot plots of SNA/Cav-3 area (A) and SNA/CAV-3 intensity (B) results, comparing control muscle biopsies (n=4) with GNE myopathy muscle biopsies (n=6). A difference in fluorescence expression between groups is present with each output parameter, although not statistically significant (Mann-Whitney unpaired t-test P value 0.0667 for both parameters).
