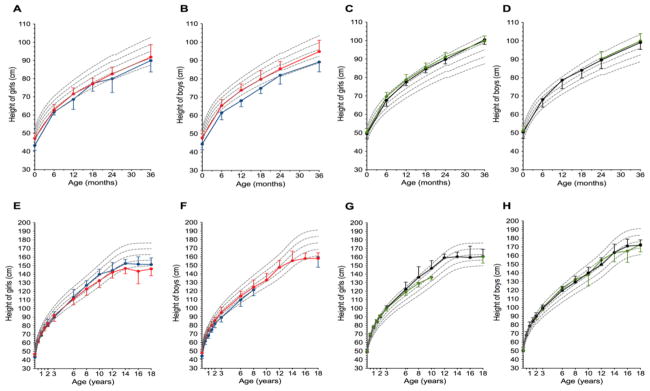
Figure 2.
Longitudinal evolution of length/height depicted for the different disorders. Boys and girls affected with inactivating PTH/PTHrP Signaling Disorder or iPPSD2 [PHP1A (red dots and lines) or PPHP (blue dots and lines)] or iPPSD3 [AD-PHP1B (green dots and lines) or spor-PHP1B (black dots and lines)] are plotted on the WHO growth charts. Panels A, B, C and D zoom in the first years of life. Panels E, F, G and H depict the pattern of growth from birth to 18 years (adult height). Note the moderate acceleration of growth in the first years of life in iPPSD2 while with growth velocity is dramatically increased from birth in iPPSD3.

