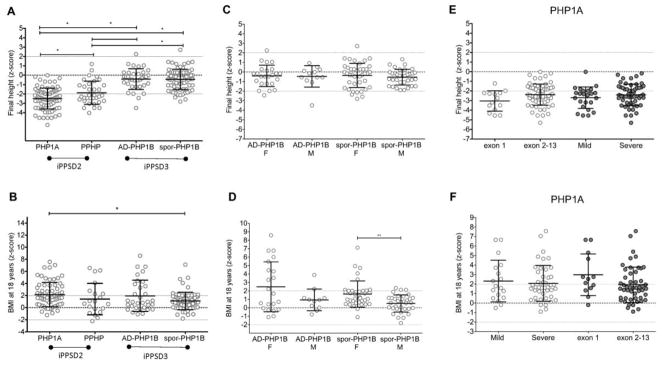
Figure 3.
Z-scores of adult height and BMI of patients affected with the different GNAS genetic and epigenetic lesions.
Raw data (dots), means and SD (lines) are presented. A and B: comparison of the final heights and BMI z-scores between the different diseases. Statistically different means (p<0.05) are indicated by *, (p<0.001) are indicated by **, (p<0.0001) are indicated by ***. Note that the scale differs between the panels. C and D represent the data divided according to the sex; E and F represent the data divided according to the genotype of the PHP1A patients.

