
Figure 3.
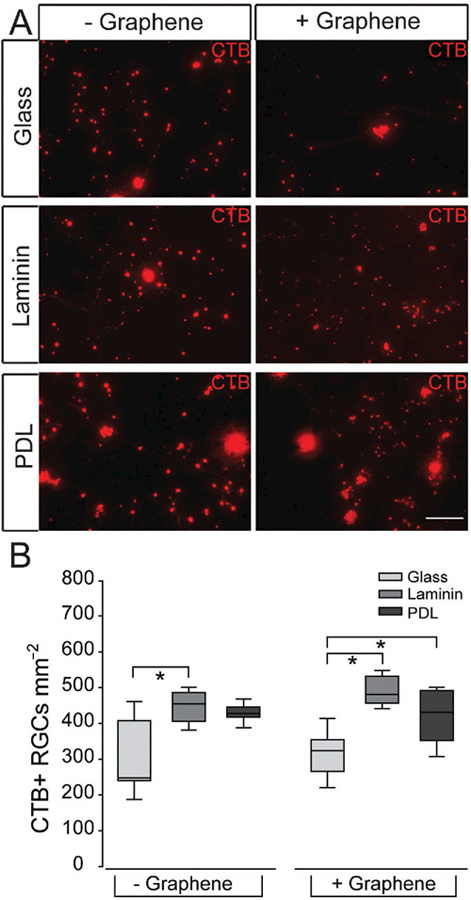
Receptor-mediated endocytosis of CTB in RGCs on culture substrates with graphene overlay. A) Representative fluorescent micrographs of RGCs cultured on glass (top), laminin (middle), or PDL (bottom) with (+) or without (−) graphene overlay. RGCs were labeled with CTB conjugated to Alexa Fluor-594 (red). Scale bar = 100 μm. B) Box plot of CTB+ cell density (y-axis; RGCs mm−2) in each culture platform. Asterisks indicate p < 0.05.