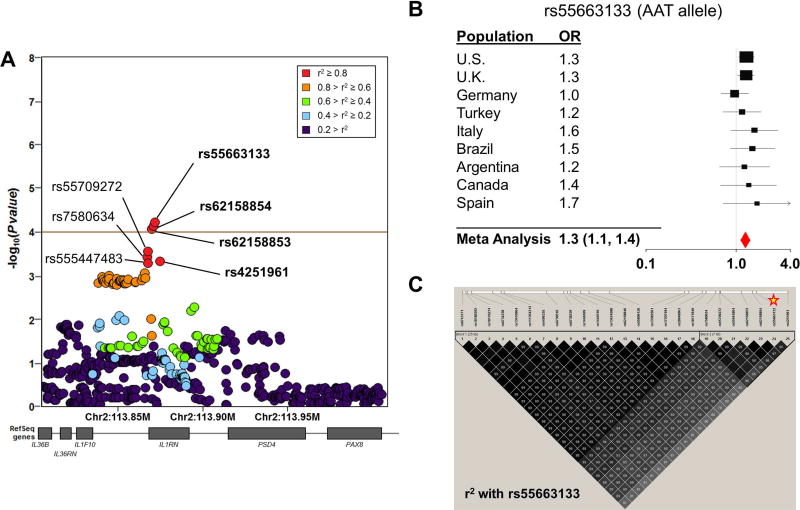
Figure 2. Variants of the IL1RN locus are associated with sJIA in the INCHARGE case-control collection.
SNP associations within the IL1RN locus are shown, colored by pairwise linkage disequilibrium (LD) with the most strongly associated SNP, rs55663133 (A). The brown horizontal line demonstrates the study-wide significance threshold. In Panel B, a forest plot demonstrates the effect size of rs55663133 by meta-analysis and in individual study populations. Panel C displays pairwise LD with the peak sJIA-associated SNP, rs55663133 (star) in the U.S. case-control population. The top 7 sJIA associated markers (19–25) form a strong LD block.

