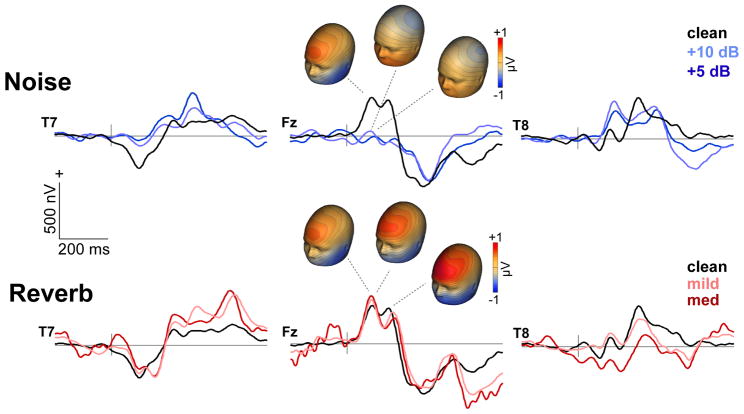
Figure 2. Cortical ERPs (electrode data).
Grand average responses at frontal and temporal channels (T7/8, Fz) to speech as a function of noise SNR (top traces) and reverb D/R (bottom traces). Responses appear as a series of obligatory waves within the first 200 ms of speech characteristic of the auditory P1- N1-P2 signature. Topographies illustrate the distribution of activity across the scalp. Blue map colors refer to negative voltage, red colors indicate positive voltage. Reverberation is less detrimental t (and in some cases facilitates) the neural encoding of speech compared to additive noise.

