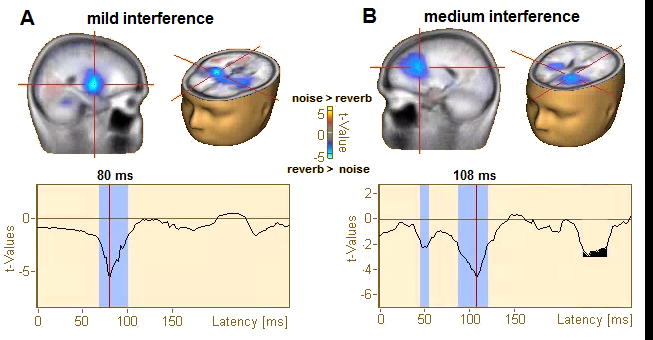
Figure 4. Statistical contrasts (t-maps) of source responses to noise and reverberant speech.

Data filtered 0.5–20 Hz (i.e., cortical activity). Functional data projected on the brain volume are displayed on the BESA brain template (Richards et al., 2016). (A) Contrast of mild forms of acoustic interference (+10 dB SNR noise vs. mild reverb). (B) Contrast of moderate forms of acoustic interference (+5 dB SNR noise vs. medium reverb). Maps are masked (p<0.05) and corrected for multiple comparisons (see text). Bottom traces show the running t-value (noise > reverb) of the cluster marker in the brain volume by crosshairs. Cool colors denote locations where reverb > noise. Degraded speech is processed in bilateral A1 and IFG. For mild acoustic interferences (A), noisy and reverberant speech are differentiable mainly in right A1. This contrasts speech in moderate interferences (B), which becomes distinguishable ~30 ms later in left IFG.
