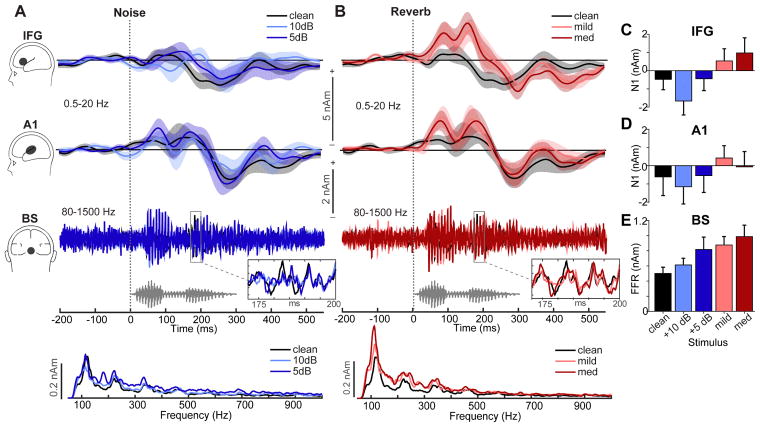
Figure 5. Brainstem FFR and cortical ERP source responses to speech in noise and reverberation.
Source waveforms (collapsed across hemispheres) extracted from cortical (IFG, A1; 0.5–20 Hz) and brainstem (BS; 80–1500 Hz) dipole sources. (A) Responses in noise, (B) Responses in reverb. Bottom traces below BS-FFR waveforms show the spectra of phase-locked activity from the brainstem source. Gray trace, stimulus waveform. (C–E) Changes in IFG, A1, and BS source amplitudes across interferences. Shading and errorbars = ±1 s.e.m.

