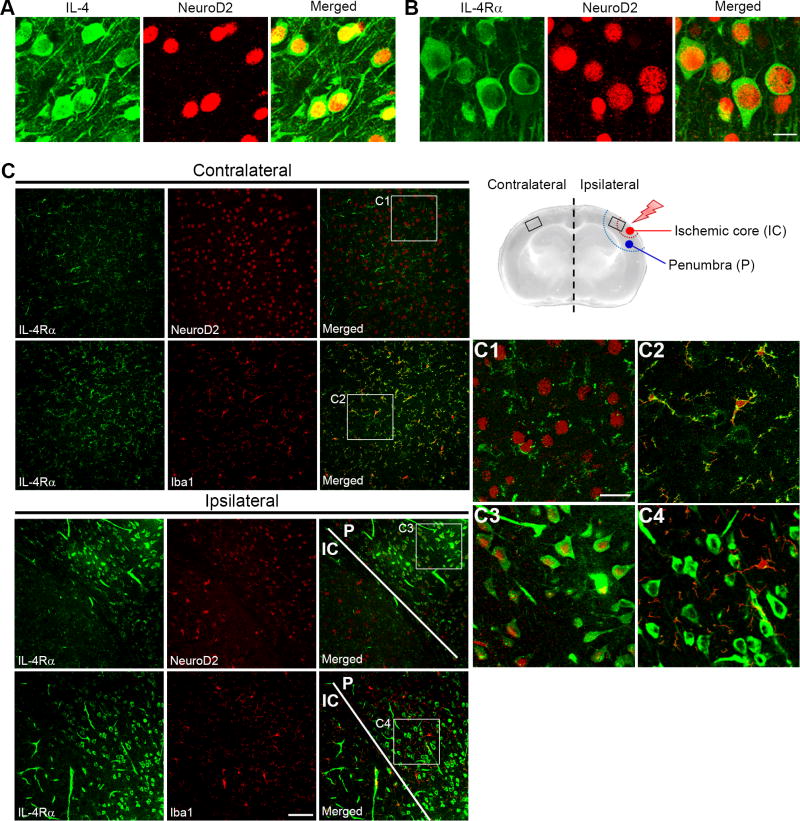
Figure 2. IL-4 and IL-4Rα are expressed on neurons in Il4rα WT mouse brain and neuronal IL-4Rα levels are increased during ischemia.
(A and B) Immunofluorescence staining for either IL-4 or IL-4Rα is indicated in green. Neurons stained with NeuroD2 are indicated in red. Merged images show that IL-4 and IL-4Rα are expressed on neurons that are located in layer 2/3 of brain cortex. Scale bar: 10 µm. (C) A schematic illustration shows the regions of the infarct (penumbra and ischemic core) after permanent MCAO in the mouse brain. Images were obtained from both the contralateral and ipsilateral regions of the mouse brain 4 h after occlusion. Immunofluorescence of IL-4Rα is shown in green and either NeuroD2 or Iba1 is shown in red. Merged images from the contralateral region of the brain (boxed regions are magnified in C1 and C2) show that IL-4Rα is predominantly expressed on microglia/macrophages but also expressed at lower levels on neurons. Merged images from the ipsilateral region of the brain (boxed regions are magnified in C3 and C4) show that 4 h after MCAO, neurons show dramatically increased levels of IL-4Rα as shown by staining with NeuroD2. Scale bar: 100 µm for most images and 30 µm for the magnified boxed regions.

