
Figure 2.
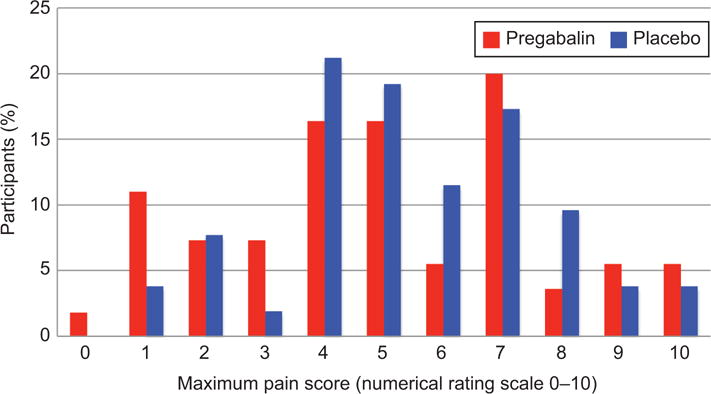
Distribution of maximum pain scores by treatment group. The percentage of participants in each study group reporting each level of maximum pain. P=.64 using the Fisher exact test.
Official websites use .gov
A
.gov website belongs to an official
government organization in the United States.
Secure .gov websites use HTTPS
A lock (
) or https:// means you've safely
connected to the .gov website. Share sensitive
information only on official, secure websites.
Distribution of maximum pain scores by treatment group. The percentage of participants in each study group reporting each level of maximum pain. P=.64 using the Fisher exact test.