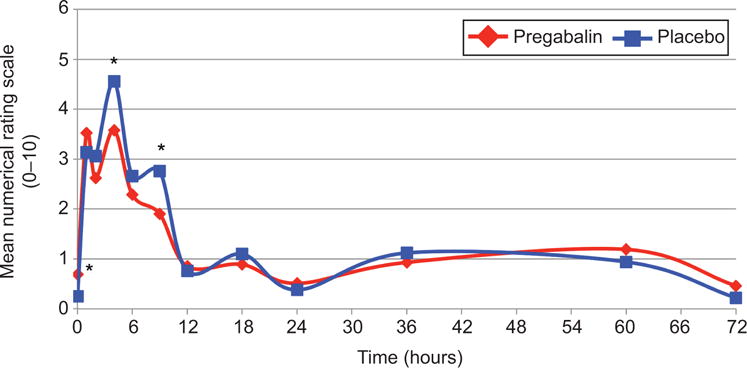
Figure 3.

Mean pain scores over time by treatment group. Mean pain scores at each time point over the study period, compared with t-tests. Because pain scores were compared at so many different time points, it is possible that some of the differences may be due to random variation. *P=.04 at time points 0, 4, and 9 hours.
