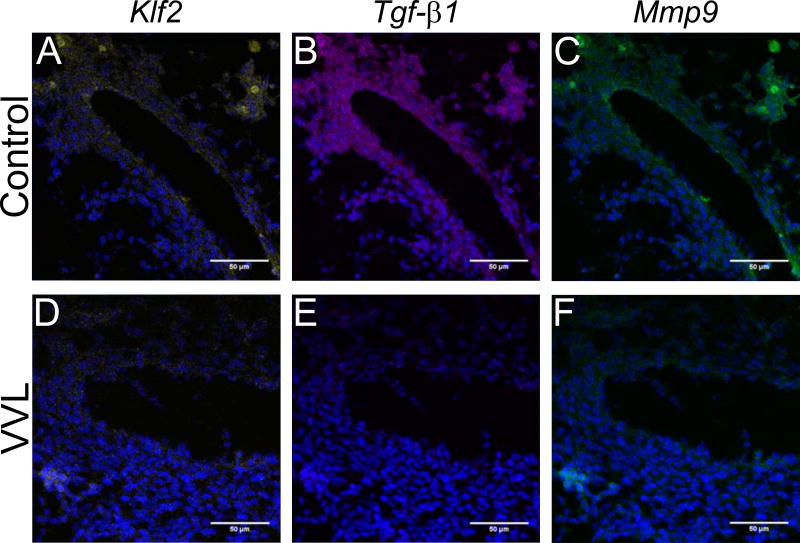
Figure 5.
ISH showing Et-1 (yellow), Eln (purple), and Lox (green) expression in control (A-C) and VVL embryos (D-F) at HH36. Cell nuclei (blue) are stained with DAPI. Et-1 expression at the intimal layer (white arrows) is increased in select VVL DAs (D) as compared to controls (A), but is not consistently observed. Both Eln and Lox expression are substantially higher in VVL vessels (E and F) compared to controls (B and C).

