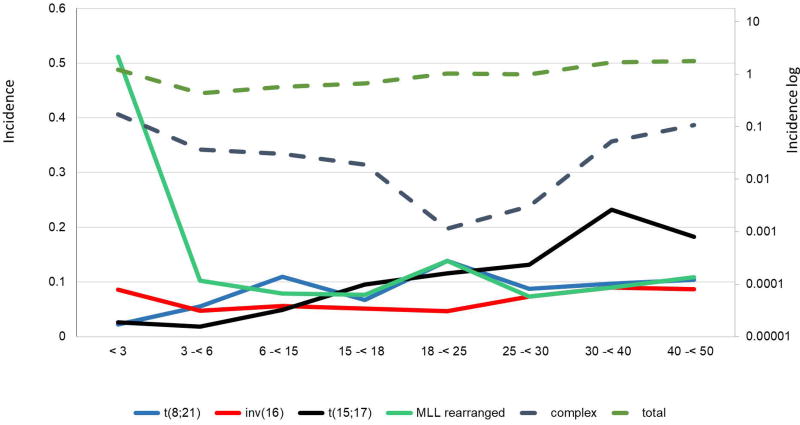
FIGURE 2.
Age-specific population-based incidences of cytogenetic subtypes in AML below 50 years of age. Absolute incidences of various cytogenetic subgroups in AML from a German population are shown. The y-axis shows absolute incidence per 100,000 individuals with the respective cytogenetic subgroups according to age. Different age groups are shown on the x-axis. Dotted lines indicate the logarithmic scale. Modified from Creutzig et al. 201622

