Fig. 2.
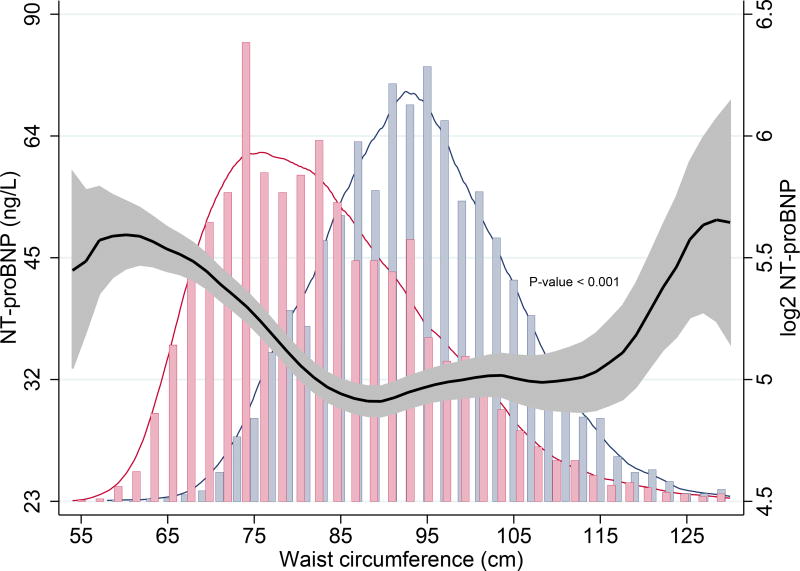
A. Association of waist circumference and NT-proBNP in the overall population using kernel-weighted local polynomial smoothing graphic modelling
Black lines represent median NT-proBNP (ng/L) levels in the overall population; Grey bands represent prediction intervals of median NT-proBNP; Histograms represent distribution of waist circumference in males (blue) and females (red); Waist circumference ≤ 130 cm
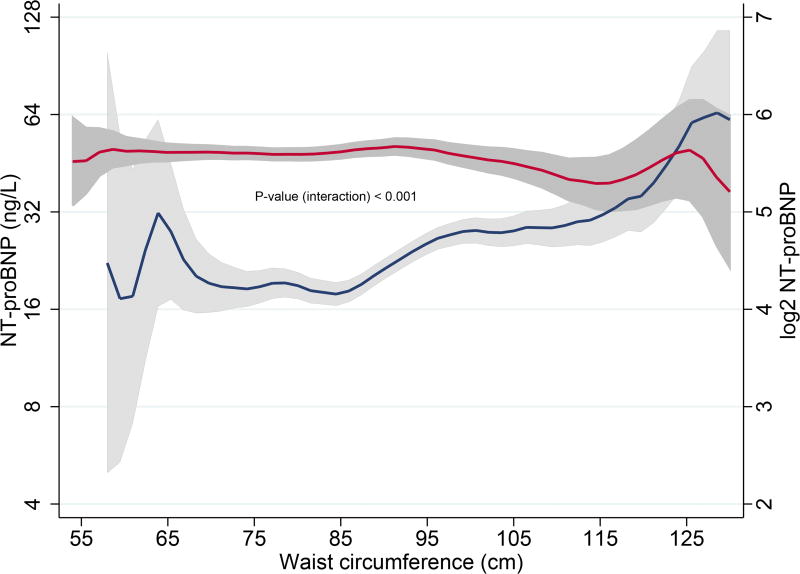
B. Associations of waist circumference and NT-proBNP levels in males and in females
Blue lines represent median NT-proBNP (ng/L) levels in males; Red lines represent median NT-proBNP (ng/L) levels in females; Grey bands represent prediction intervals of median NT-proBNP; Waist circumference ≤ 130 cm


