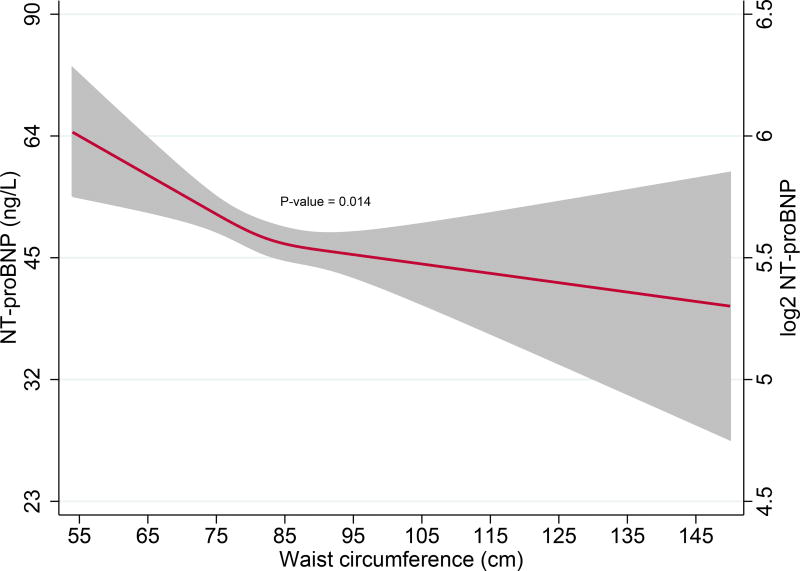
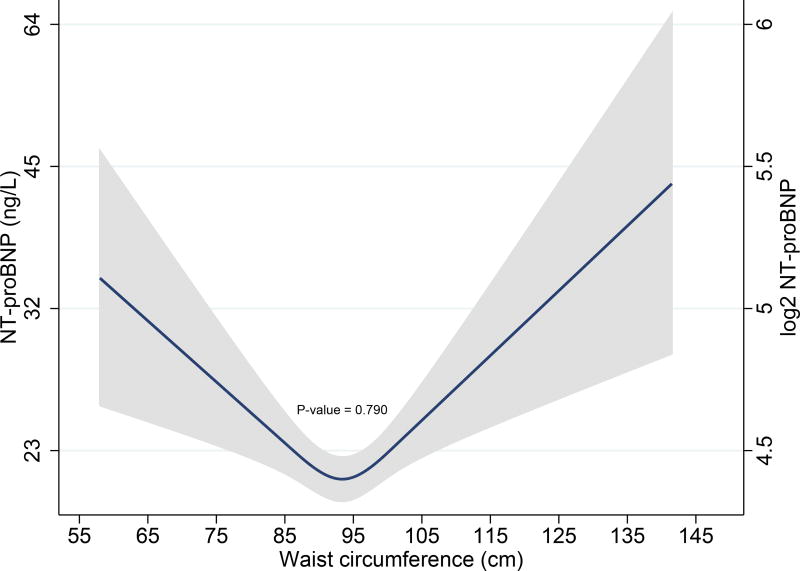
Fig 5.
A. Restricted cubic spline curves depicting associations of waist circumference with NT-proBNP levels after multivariable adjustment in females
Red lines represent plasma NT-proBNP (ng/L) levels in females; Restricted cubic spline curves represent associations after adjusting for age, myocardial infarction, hypertension, hypertensive drug usage, insulin resistance, glomerular filtration rate, C-reactive protein and body-mass index
B. Restricted cubic spline curves depicting associations of waist circumference with NT-proBNP levels after multivariable adjustment in males
Blue lines represent plasma NT-proBNP (ng/L) levels in males; Restricted cubic spline curves represent associations after adjusting for age, myocardial infarction, hypertension, hypertensive drug usage, insulin resistance, glomerular filtration rate, C-reactive protein and body-mass index


