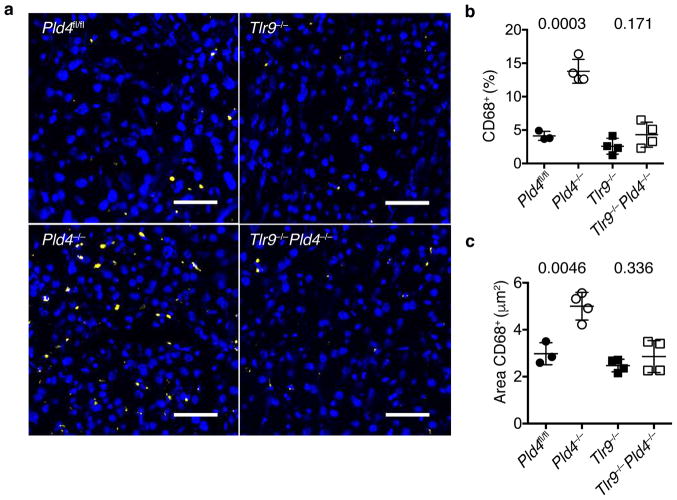
Figure 2.
Effect of Pld4 and Tlr9 deficiency on liver infiltration by CD68+ macrophages. (a) Frozen sections of liver from mice of the indicated genotypes were stained with Hoechst dye (blue) and antibody for CD68 (yellow). Scale bar indicates 50 μm. Analysis of (b) the percentages of liver cells staining with CD68 antibody relative to Hoechst 33258+ cells and (c) the area occupied by CD68+ cells in mice of the indicated genotypes. Each point in (b,c) represents the value measured in an independent mouse (mean and SD shown, n=3,4,4,4; P value calculated by unpaired 2-tailed T test).

