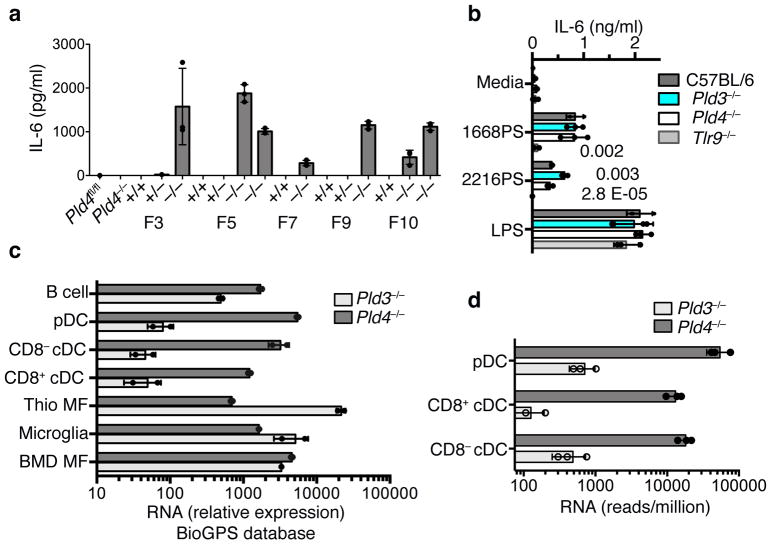
Figure 4.
Exaggerated responses of Pld3−/− thioglycolate-elicited macrophages to an A-type TLR9 agonist and analysis of relative RNA expression of Pld3 and Pld4 in selected cell types. (a) Elevated IL-6 responses of thioglycolate-elicited macrophages from independent Pld3−/− founder lines to in vitro incubation with ODN 2216PS. Founder lines 3, 5, 7, 9, and 10 were outcrossed to C57BL/6 then intercrossed to yield heterozygosity or homozygosity of the Pld3 mutations indicated in Fig. S1j, or homozygosity of the wild-type Pld3 allele. Results shown are from triplicate cultures performed once, showing mean and SD. (b) TLR9-dependence and elevated responses of Pld3−/− thioglycolate-elicited macrophages. PLD3-deficient macrophages of founder line 7 were challenged with the indicated stimuli and the IL-6 response compared to Pld4−/−, Tlr9−/−, or wild-type cells as indicated. Bars show mean and points show values obtained in 3 separate cultures. P values calculated by two-tailed T test. These experiments were repeated at least twice. (c,d) Analysis of Pld3 and Pld4 expression. Points show independent RNA samples and bars show geometric mean. (c) RNA expression data from the BioGPS MOE430 Gene Atlas Data set of the indicated mouse cell types: including dendritic cells (CD8α+ DCs, CD8α− DCs, and pDCs), B cells, bone marrow-derived macrophages (BMD MF), and thioglycolate-elicited macrophages (Thio MF). n=2,2 independent RNA samples. (d) RNA sequencing analysis of Pld3 and Pld4 expression in DC subsets. n=3,3; each data point was from sorted cells of independent pools of splenocytes from 10–14 mice.

