Figure 6.
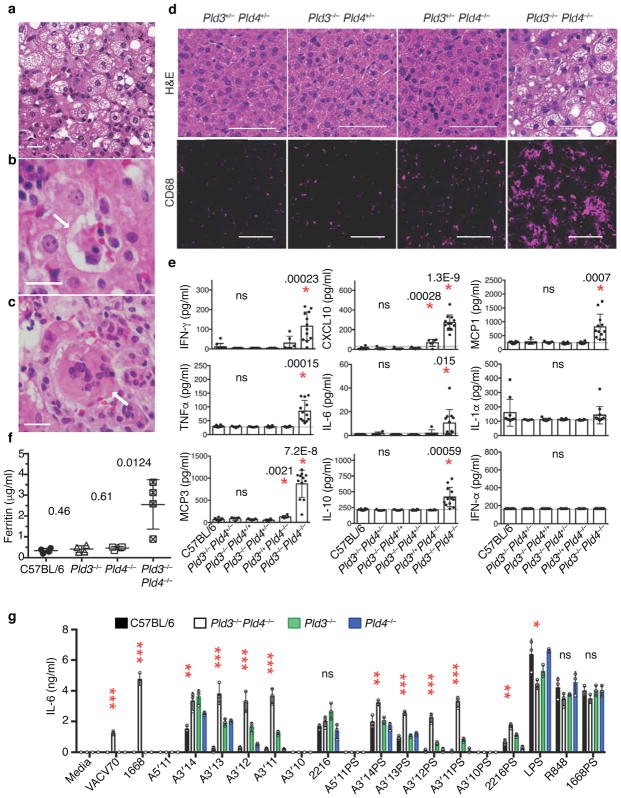
Liver inflammation and elevated inflammatory cytokine production in Pld3−/−Pld4−/− mice. (a–c) Hematoxylin/eosin (H&E) staining of paraffin-embedded sections from Pld3−/−Pld4−/− livers; scale bars are 50 μm. Pathogenic features of disease include (a) vesicular hepatopathy (steatosis), (b) hemophagocytosis (arrow), and (c) hepatic multinucleate cells (arrow). (d) H&E analysis of liver sections of littermates with the indicated genotypes (upper panels, scale bar 50 μm) or CD68 immunofluorescent staining of frozen liver sections derived from different lobes of the same liver (lower, scale bar 100 μm). These data are representative of at least 3 mice/group. (e) Serum cytokines measured in 16–19 day-old mice of the indicated genotypes. n=10, 5, 7, 6, 6, 12 for C57BL/6, Pld3+/−Pld4+/−, Pld3−/−Pld4+/+, Pld3−/−Pld4+/−, Pld3+/+Pld4−/−, Pld3−/−Pld4−/−, respectively. P values calculated by two-tailed T test; asterisks indicate significant differences. Dotted lines in (e) indicate assay background. (f) Serum ferritin concentrations from indicated genotypes n= four/group. (g) IL-6 secretion by bone marrow-derived macrophages isolated from 19 day-old C57BL/6, Pld3−/−, Pld4−/− or Pld3−/−Pld4−/− mice after stimulation with indicated TLR agonists. Asterisks refer to significant differences between C57BL/6 and Pld3−/−Pld4−/−. *, **, *** denote P< 0.05, .01, .001, respectively. Significance of IL-6 responses assessed by unpaired two-tailed T-test. All plots show mean and SD of triplicate cultures; this experiment was repeated a second time with similar results.

