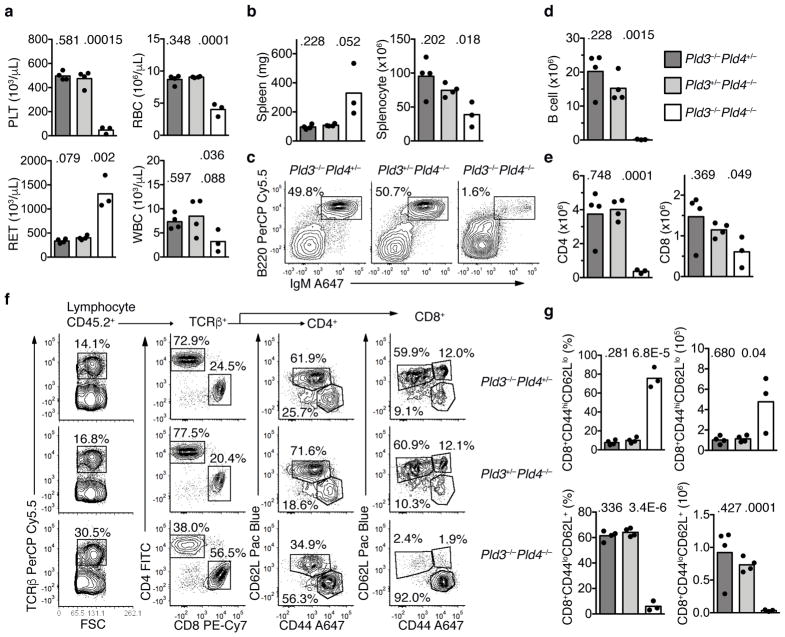
Figure 7.
Transfer of an inflammatory disease by transplantation of Pld3−/−Pld4−/− bone marrow. (a) Eight weeks post transfer, whole blood was analyzed for platelet (PLT), red blood cell (RBC), reticulocyte (RET) and white blood cell (WBC) counts from B6.SJL-CD45.1 recipient mice receiving bone marrow of the indicated genotypes: Pld3−/−Pld4+/− (dark grey bar), Pld3+/−Pld4−/− (light grey bar), Pld3−/−Pld4−/− (white bar). Bar indicates mean and symbols indicate individual recipient values. (b) Spleen weight (mg) and splenocyte count after erythrocyte lysis was determined 8 weeks post transfer. (c) Representative flow cytometry plots indicating recipient splenic CD45.2+-gated B cell populations stained with B220 and IgM from the indicated bone marrow donors. Summary data shown in d. (d) Numbers of donor (CD45.2+) B220+IgM+ B cells identified in spleens as gated in (c). (e) Numbers of CD45.2+TCRβ+CD4+ (left) or CD8+ (right) T cells from the spleens of recipient mice transferred with donor bone marrow of the indicated genotypes. (f) Representative flow cytometry plots of splenic CD45.2+ cells from mice receiving bone marrow of the indicated genotypes. Panels show gating and proportions of TCRβ+, CD4 and CD8 T cells. Cells gated on either CD4 or CD8 cells were further analyzed by CD62L and CD44 staining. Summary data shown in g. (g) Frequencies and numbers of CD8 T cells staining CD44hiCD62Llo (upper panel) or CD44loCD62L+ (lower panel) in the spleens of recipients receiving bone marrow of the indicated genotypes. n=4, 4, 3 for Pld3−/−Pld4+/−, Pld3+/−Pld4−/−, and Pld3−/−Pld4−/−, respectively. Two-tailed T test was used to calculate P values. This experiment was performed once.

