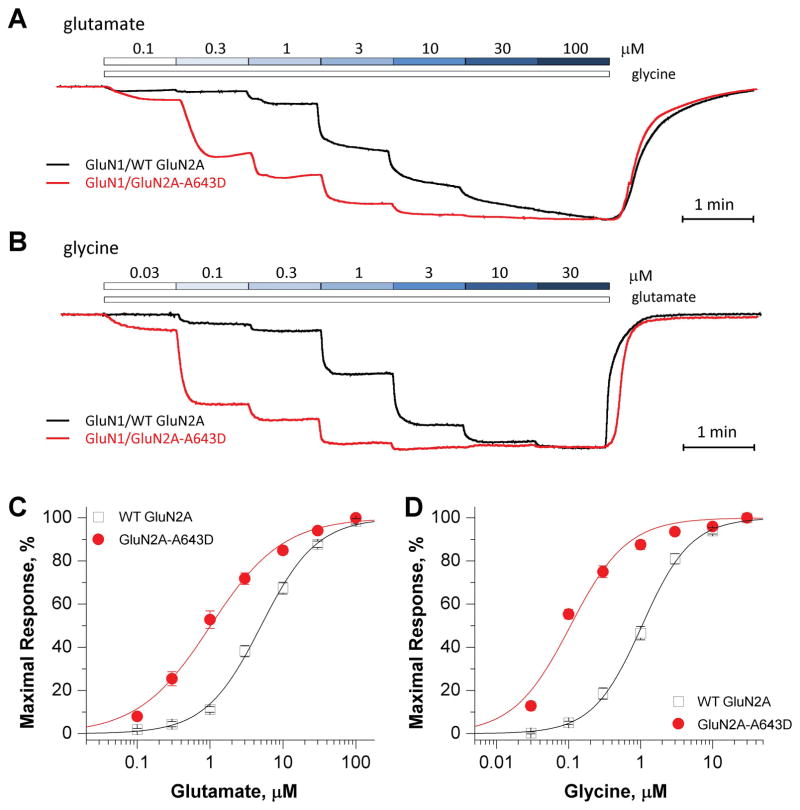
Figure 2. GluN2A-A643D increases agonist potency.
(A, B) Superimposed representative concentration-response TEVC traces for increasing concentrations of glutamate (A; in the presence of 30 μM glycine) and glycine (B; in the presence of 100 μM glutamate) for WT (wild-type) GluN2A- (black), and GluN2A-A643D- (red) expressing Xenopus laevis oocytes. (C, D) Fitted composite glutamate and glycine concentration-response curves for WT GluN2A- and GluN2A-A643D-expressing Xenopus laevis oocytes. The percentage of maximal current response is plotted as a function of agonist concentration in μM. TEVC recordings were conducted at a holding potential of −40 mV.

