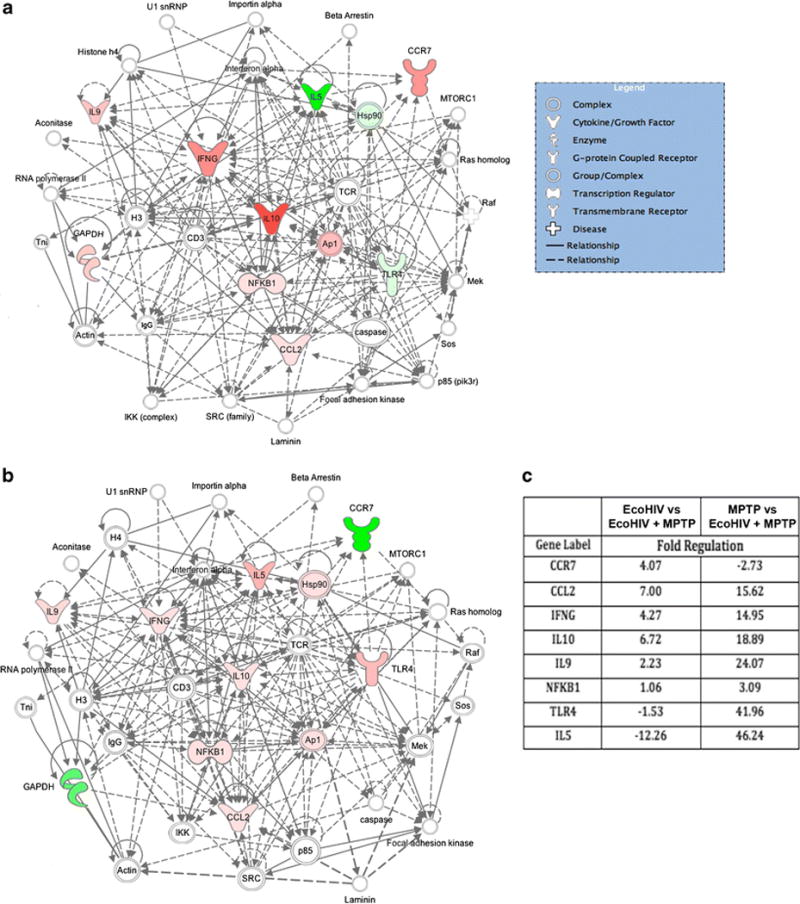
Figure 6. EcoHIV co-infection leads to changes in the inflammatory response pathway.

RT-PCR data shows gene expression changes in the ventral midbrains of C57BL/6 mice inoculated with EcoHIV followed by MPTP intoxication (n = 3–4). Fold changes were determined using SABioscience RT2 Profiler PCR Array Data Analysis software, version 3.5. A. Changes in the inflammatory response pathway associated with EcoHIV infection alone vs EcoHIV + MPTP co-treatment. B. Changes in the inflammatory response pathway associated with MPTP intoxication alone vs EcoHIV + MPTP co-treatment. Resulting gene networks from each treatment group were analyzed using Qiagen Ingenuity Pathway Analysis. Pink coloration indicates a modest increase in expression and red indicates a profound increase in expression. Green coloration indicates a decrease in expression. Nodes lacking color indicate a molecule involved in the pathway, but not identified in the PCR data set. C. Fold changes for differentially regulated mRNA levels with EcoHIV + MPTP treatment normalized to either EcoHIV treatment alone or MPTP intoxication alone.
