Fig. 4.
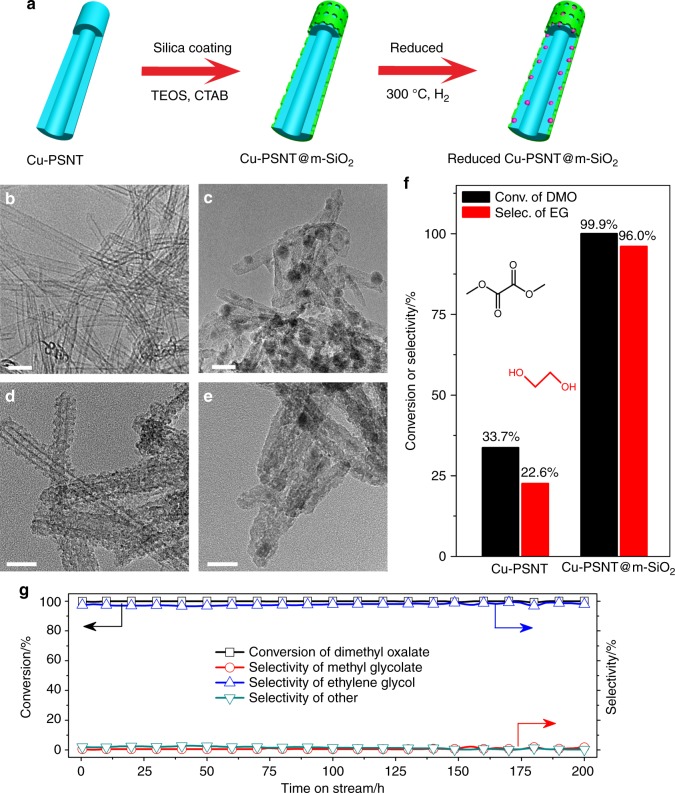
Confined growth strategy for maximizing Cu–O–SiOx interface. a Illustration of the synthetic strategy for the preparation of Cu-PSNT@m-SiO2; b–e TEM image of as-prepared Cu-PSNT, reduced Cu-PSNT, Cu-PSNT@m-SiO2 and reduced Cu-PSNT@m-SiO2, respectively; f Catalytic performance of reduced Cu-PSNT and reduced Cu-PSNT@ m-SiO2 for the selective hydrogenation of DMO to EG (LHSV = 7.8 h−1); g Catalytic performance of reduced Cu-PSNT@m-SiO2 catalyst as a function of time-on-stream (LHSV = 2.0 h−1). Reaction conditions were as follows: H2/DMO = 80 mol/mol, P (H2) = 3.0 MPa, T = 200 °C. Scale bars are 20 nm for (b–e)

