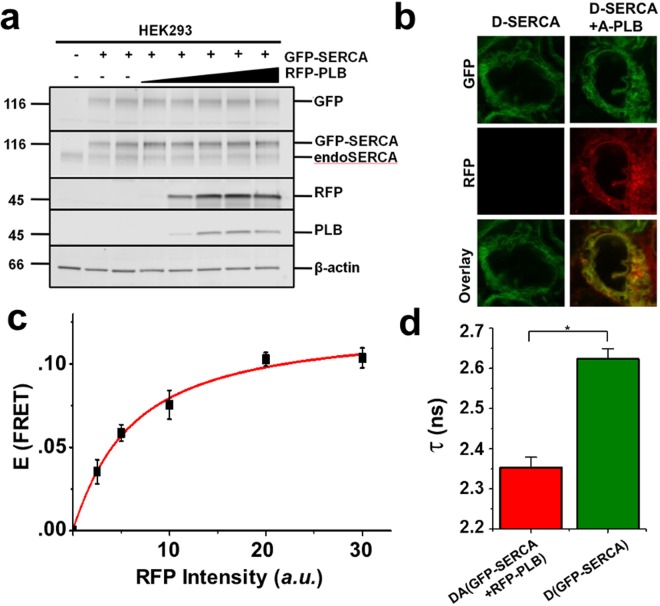
Figure 2.
Biochemical and spectroscopic characterization of SERCA2a-PLB biosensor. (a) Immunoblots of homogenates from untransfected HEK293 cells (lane 1), cells expressing GFP-SERCA2a (lanes 2-3), or cells expressing GFP-SERCA2a and increasing amounts of RFP-PLB (lanes 4–8). Antibodies from top to bottom are anti-GFP, anti-SERCA2, anti-RFP, anti-PLB and anti-β-actin, and the image has been cropped. (b) Confocal fluorescence imaging of HEK293 cells expressing GFP-SERCA2a (left) or GFP-SERCA2a and RFP-PLB (right). (c) FRET efficiency E from GFP-SERCA2a (donor) to RFP-PLB (acceptor) shows hyperbolic dependence on acceptor concentration. (d) The mean FLT in the presence of saturating acceptor is τDA = 2.35 ± 0.02 ns, corresponding to E = 0.103 ± 0.004. Error bars indicate SD (n = 3). Statistical differences determined using the Student’s t test: *P ≤ 0.01.

