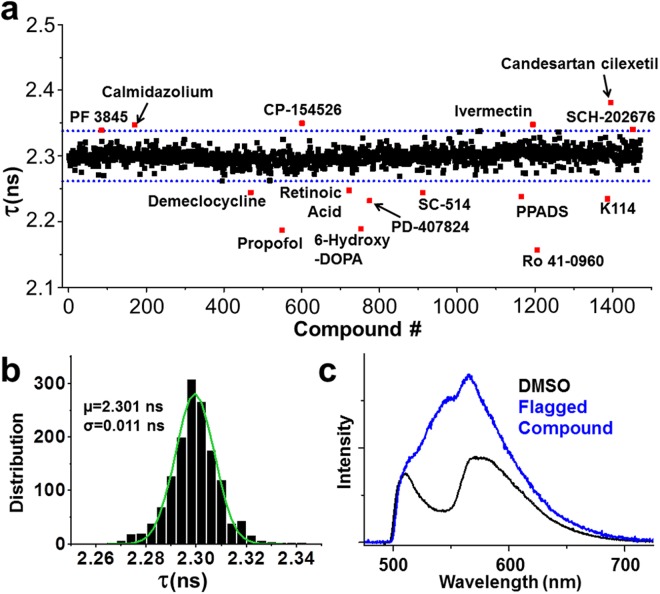
Figure 4.
High-throughput screen results. Compounds were screened in triplicate at a final concentration of 10 µM. (a) FLT values from one representative screen including DMSO control wells with a Hit threshold (>3 S.D. of mean) indicated by dotted blue lines. (b) Gaussian fit of the FLT distribution. (c) SERCA2a-PLB biosensor visible emission spectrum upon excitation at 473 nm (black). Addition of a fluorescent compound greatly alters the spectrum (blue).

