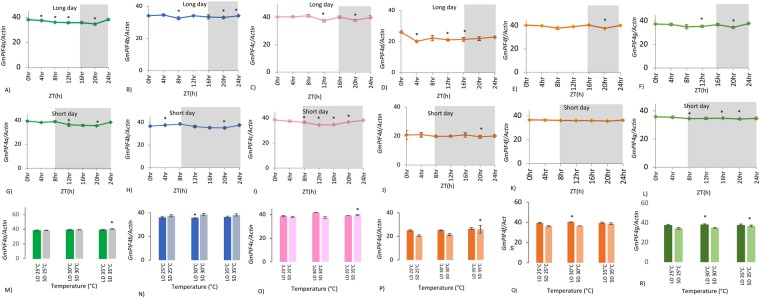
Figure 4.
Expression of GmPIF4a-d,f,g transcription factors under different photoperiods and temperatures. (A–F) The expression levels of mRNA transcripts tested at different time points (0, 4, 8, 12, 16, 20 and 24 h) under long day photoperiod conditions. (G–L) The expression levels of mRNA transcripts tested at different time points (0, 4, 8, 12, 16, 20 and 24 h) under SD photoperiod conditions. (M–R) The expression levels of mRNA transcripts tested at three different temperatures (25 °C, 30 °C, and 35 °C) under both long day and SD photoperiods. Data are from three independent biological experiments, and error bars indicate standard deviations. Significant differences between data were calculated using Student’s t-test (all time points have been compared to time point of 0 h). Significant differences are indicated with asterisks (*), P < 0.05. Intervals on X-axis represent time points/temperature points and intervals on Y-axis represent expression levels calculated by the 40-ΔCt method. The shaded area of the graph represents night. At 0 h, samples were collected in the dark, just before the day began (dawn), and for temperature experiments all samples were collected just before the day began (dawn).

