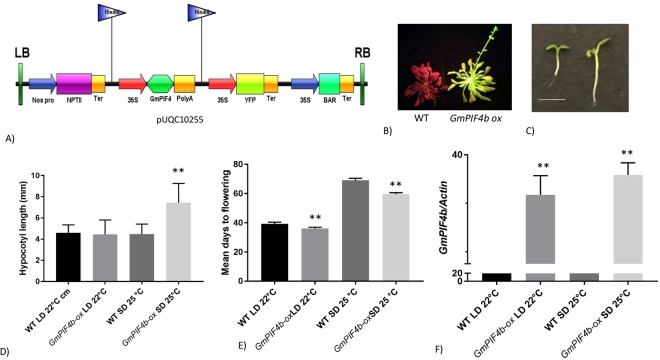
Figure 5.
Overexpression analysis of GmPIF4b in Col-0 Arabidopsis background. (A) Binary vector construct containing GmPIFb CDS driven by the 35s promoter. (B) Early flowering phenotype in GmPIF4b-ox lines at SD 25 °C, (C) Hypocotyl length phenotype in GmPIF4b-ox lines at SD 25 °C. (D) Measurement of hypocotyl length of different lines. (E) Mean days to flowering of different lines. (F) Expression levels of GmPIF4b in WT and GmPIF4b-ox lines normalized against Arabidopsis actin gene. The significant differences between data were calculated using Student’s t-test. Significant differences are indicated with asterisks: (*)P < 0.05 and (**)P < 0.01. Error bars represent SD, n = 10. WT plants appear orange because they were observed in blue light.

