Figure 2.

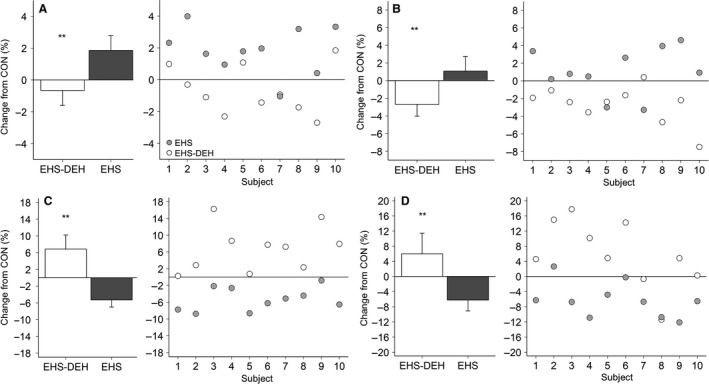
Left panel (A–D) Mean (±95% Confidence Interval) relative change (from resting control; CON) within cerebellar gray matter (A), thalamus (B), all ventricles (C), and nonventricular cerebrospinal fluid (D), during exercise heat stress (EHS) and exercise heat stress coupled with dehydration (EHS‐DEH). Right panel within (A–D) Relative changes for each individual subject (n = 10) following EHS (filled circles) and EHS‐DEH (open circles). *P < 0.05, **P < 0.01 versus EHS.
