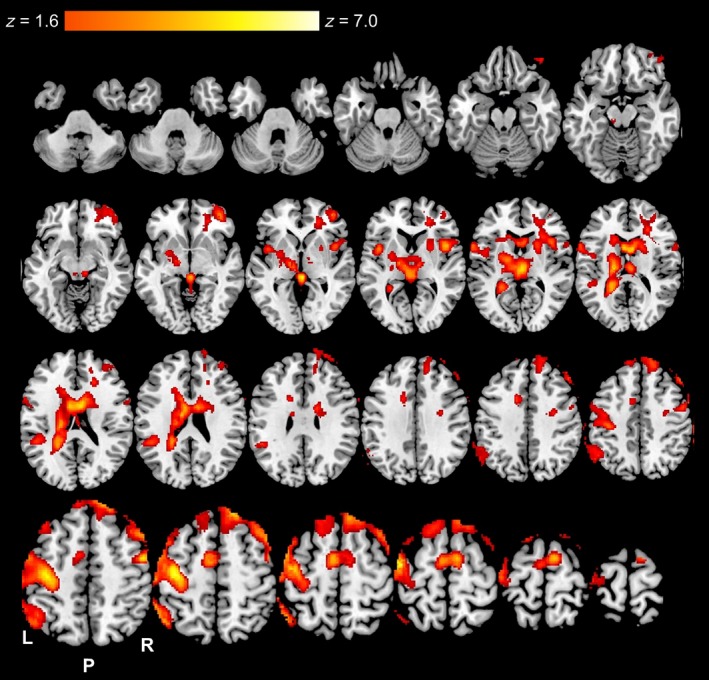
Figure 4.

Axial slices of significantly (Z ≥ 1.6 with cluster correction of P < 0.05) elevated Blood‐Oxygen‐Level‐Dependent (BOLD) responses throughout the entire visuomotor pacing task during the resting control (CON) trial (n = 10). Color gradient indicates level of elevated BOLD responses.
