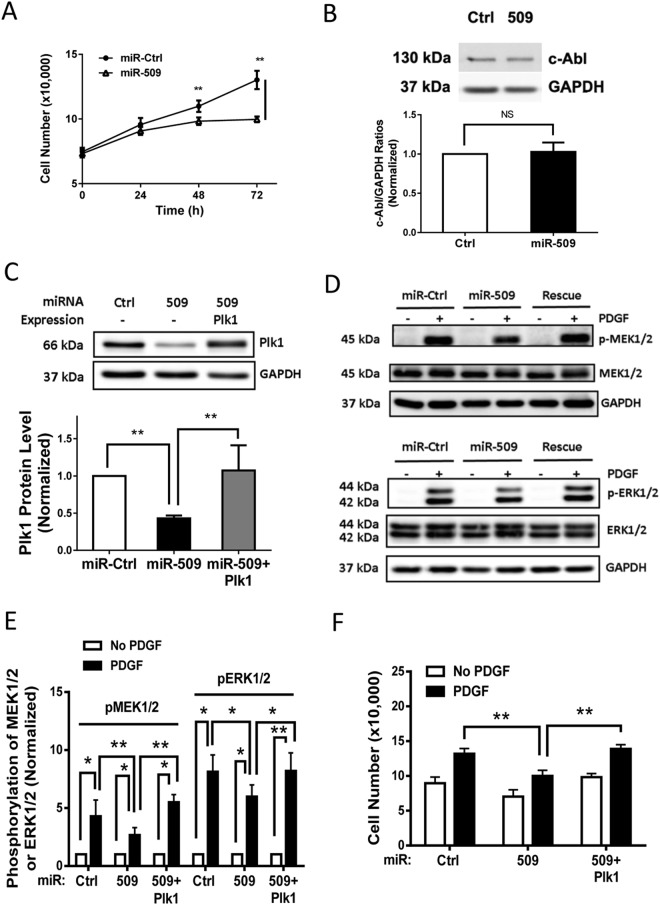
Figure 3.
Role of miR-509 in cell proliferation, c-Abl expression, MEK1/2 and ERK1/2 phosphorylation. (A) HASM cells were transfected with miR-Ctrl or miR-509. One day after transfection, they were stimulated with 10 ng/ml PDGF for additional 1–3 days followed by assessment of cell numbers. Exposure to miR-509 inhibits the PDGF-induced proliferation. Data are mean ± SD (n = 5, **p < 0.01). (B) Treatment with miR-509 does not affect c-Abl protein expression. Blots of HASM cells transfected with either miR-Ctrl or miR-509 for 3 days were probed with antibodies against c-Abl and GAPDH. Data are mean ± SD (n = 5). NS, not significant. (C) HASM cells treated with miR-Ctrl or miR-509 for 3 days, or stable Plk1 (miR-509 resistant) expressing cells were treated with miR-509 for 3 days (rescue cells). Cell extracts were evaluated by immunoblot analysis. Data are mean ± SD (n = 5, **p < 0.01). (D) Representative immunoblots illustrating the role of Plk1 in phosphorylation of MEK1/2 (MEK1: Ser-218/Ser-222; MEK2: Ser-222/Ser-226) and ERK1/2 (ERK1: Thr-202/Tyr-204; ERK2: Thr-185/Tyr-187). HASM cells treated with miR-Ctrl or miR-509, or rescue cells (see above) were stimulated with 10 ng/ml PDGF for 10 min or left unstimulated. MEK1/2 and ERK1/2 phosphorylation in these cells was evaluated by immunoblot analysis. Rescue of Plk1 in miR-509 treated cells restores the PDGF-induced phosphorylation of MEK1/2 and ERK1/2. (E) The phosphorylation levels of MEK1/2 and ERK1/2 in cells stimulated with PDGF are normalized to corresponding unstimulated levels. Data are mean ± SD (n = 7, *p < 0.05; **p < 0.01). (F) Smooth muscle cells were treated with miR-Ctrl or miR-509, or stable Plk1 expressing cells were treated with miR-509. One day after treatment, they were stimulated with 10 ng/ml PDGF for 3 days. The numbers of viable cells were then determined. Rescue of Plk1 in miR-509 treated cells recovers the PDGF-induced proliferation in HASM cells. Data are mean ± SD (n = 5, **p < 0.01). Student’s t-test was used for statistical analysis of (A,B). One-way ANOVA was used for statistical analysis of (C). Two-way ANOVA was used for statistical analysis of (E,F).

