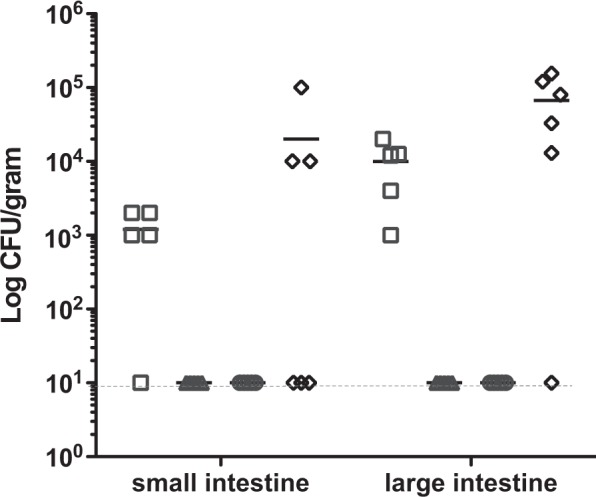
Figure 1.

Bacterial load for the small intestine and large intestine at day 6 post-inoculation. Data is displayed as log cfu per gram of intestinal content, n = 5. 11168-O (□), 11168-OΔccaA::cat (Δ), negative non-infected control (○), competition 11168-O WT and ΔccaA::cat (◊). Bar indicates average cfu/gram for each group. <10 cfu/gram of intestinal content was detected for 11168-OΔccaA::cat and mock infected. Broken line indicates level of sensitivity.
