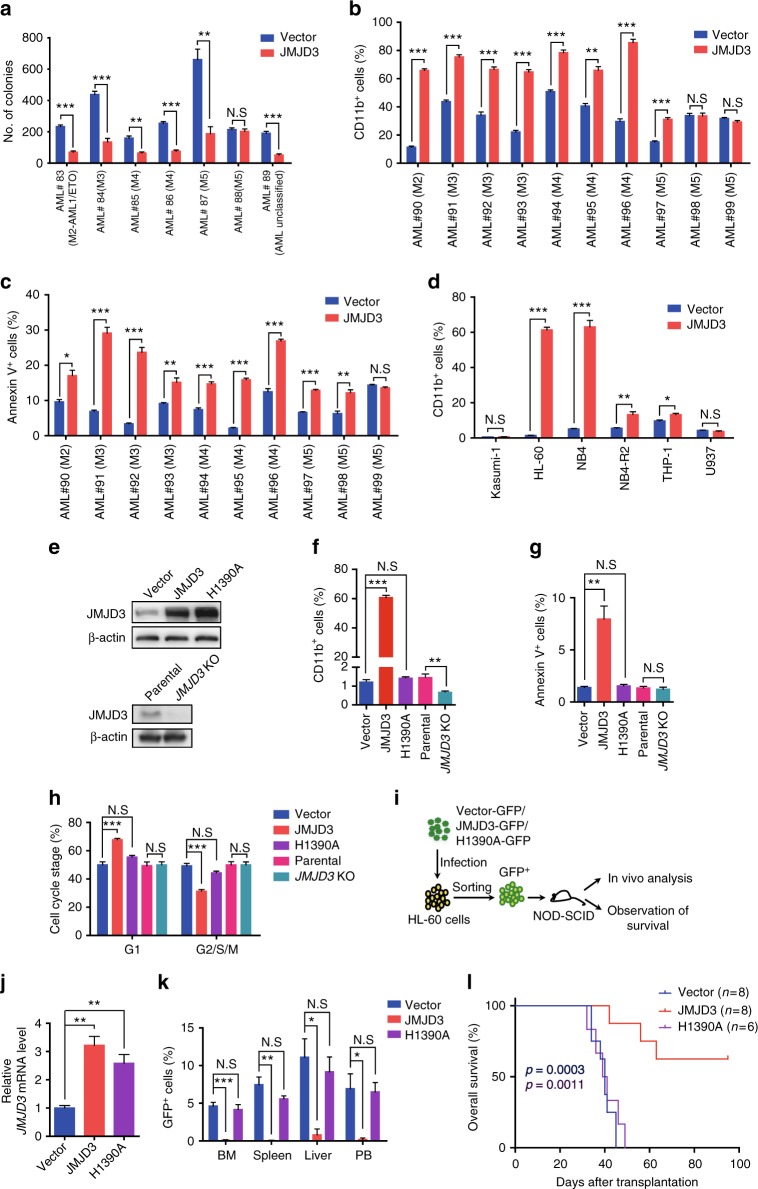
Fig. 3.
JMJD3 exhibited anti-human AML activity in a demethylase-dependent manner. a The number of the leukemic colony forming units for seven primary AML blast samples transduced with control vector or JMJD3-expressing vector. b, c Flow cytometric analyses of CD11b expression (b) or Annexin V staining (c) on ten primary AML blast samples transduced with control vector or JMJD3-expressing vector. d Flow cytometric analyses of CD11b expression on six AML cell lines transduced with control vector or JMJD3-expressing vector. e Western blotting assay on JMJD3 protein in HL-60 cells transduced with vector control, JMJD3-, or H1390A mutant-expressing vector (upper panel), and in parental and JMJD3 KO HL-60 cell lines (bottom panel). f–h Flow cytometric analyses of CD11b expression (f), Annexin V staining (g), and cell cycles (h) in HL-60 cells transduced with vector control, JMJD3-, or H1390A mutant-expressing vector, or in parental or JMJD3 knockout HL-60 cells. i Experimental protocol for testing the in vivo proliferative capacity of HL-60 cells transduced with vector control, JMJD3-, or H1390A mutant-expressing vector in NOD/SCID mice; 5 × 10⁶ transduced GFP+ HL-60 cells were intravenously transplanted into each NOD/SCID mouse. j qRT-PCR assay on the JMJD3 mRNA level of GFP+ HL-60 cells isolated from the BM at 35 days after transplantation. k The percentages of GFP+ cells in BM, spleen, liver, and PB at 35 days after transplantation. l Kaplan–Meier survival curves of NOD/SCID mice injected with HL-60 cells transduced with vector control, JMJD3-, or H1390A mutant-expressing vector; p = 0.0003 (blue), vector versus JMJD3; p = 0.0011 (purple), H1390A versus JMJD3. Data are shown as the mean ± SEM; *p < 0.05, **p < 0.01, ***p < 0.001

