Fig. 5.
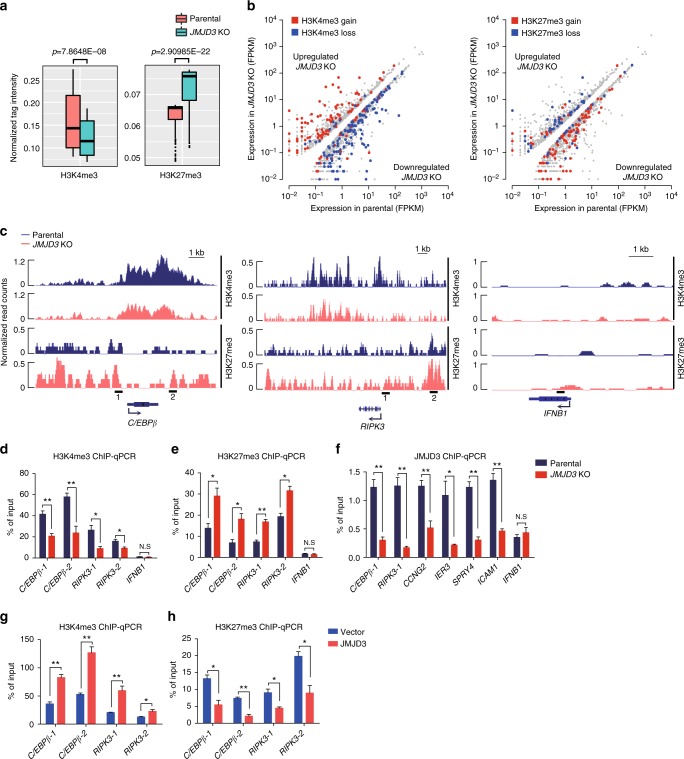
JMJD3 regulates dynamic H3K4me3 and H3K27me3 modifications in the promoter of myelopoietic genes. a Box plots showing the differences of H3K4me3 (left) and H3K27me3 (right) occupancies around the promoter (with 3 kb upstream or downstream of the TSS) of parental and JMJD3 knockout HL-60 cells. b The loci of the downregulated genes in JMJD3 deficiency exhibit a decrease in H3K4me3 (blue dots, left panel) but an increase in H3K27me3 level (red dots, right panel). FPKM, fragments per kilobase of transcript per million fragments mapped. c Genome browser tracks representing the binding sites of H3K4me3 and H3K27me3 at the C/EBPβ or RIPK3 gene locus in parental and JMJD3 knockout HL-60 cells. d, e ChIP–qPCR assay for H3K4me3 (d) and H3K27me3 (e) at the C/EBPβ, RIPK3 or IFNB gene locus in parental and JMJD3 knockout HL-60 cells. f ChIP–qPCR assay for JMJD3 occupancy at a number of gene loci in parental and JMJD3 knockout HL-60 cells. g, h ChIP–qPCR assay for H3K4me3 (g) and H3K27me3 (h) at the C/EBPβ or RIPK3 gene locus in HL-60 cells transduced with empty vector or JMJD3-expressing vector. Data are shown as the mean ± SEM; *p < 0.05, **p < 0.01

