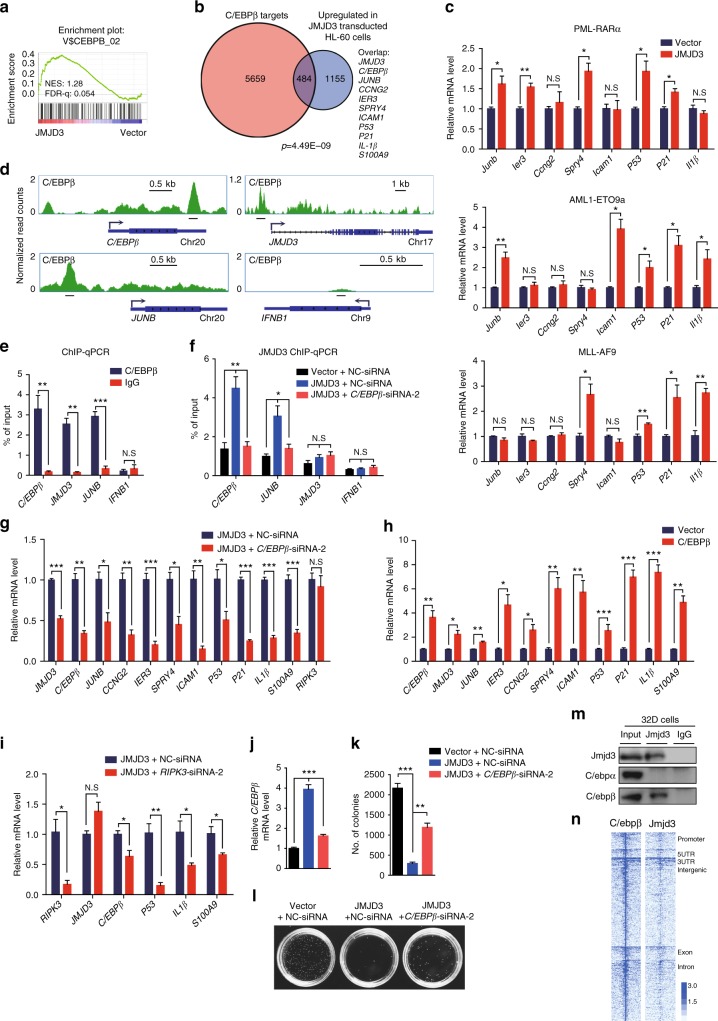
Fig. 6.
JMJD3 upregulates and partners with C/EBPβ to regulate the expression of key myelopoietic genes in AML cells. a GSEA of the expressing profile of HL-60 cells transduced with control or JMJD3-expressing vector using a C/EBPβ target genes-associated signature. b Venn diagram showing the overlap between C/EBPβ promoter targets in C/EBPβ-overexpressed HL-60 cells (red, see also Supplementary Data 4) and the upregulated genes in JMJD3-overexpressed HL-60 cells (gray, see also Supplementary Data 2) with a p value calculated by hypergeometric test. c GFP+ murine AML BM cell samples from PML-RARα- (upper panel), AML1-ETO9a- (middle panel), or MLL-AF9- (low panel) expressing transgenic mice were transduced with an empty vector or JMJD3-expressing vector, and the mRNA levels of a number of genes were measured by qRT-PCR. d Genome browser tracks representing the binding sites of C/EBPβ at the C/EBPβ, JUNB, JMJD3 or IFNB1 gene locus. e ChIP–qPCR assay for C/EBPβ or IgG occupancy at the C/EBPβ, JUNB, JMJD3 or IFNB1 gene locus in C/EBPβ-overexpressed HL-60 cells. f ChIP–qPCR assay for JMJD3 occupancy at the C/EBPβ, JUNB, JMJD3 or IFNB1 gene locus for NC or C/EBPβ knockdown HL-60 cells transduced with control or JMJD3-overexpressed vector. g qRT-PCR assay on the mRNA levels of a number of genes when HL-60 cells were transduced with control or C/EBPβ-expressing vector. h qRT-PCR assay on the mRNA levels of a number of genes when JMJD3-overexpressed HL-60 cells were transduced with or without C/EBPβ siRNA. i qRT-PCR assay on the mRNA levels of a number of genes when JMJD3-overexpressed HL-60 cells were transduced with or without RIPK3 siRNA. j–l The number and typical pictures of the colonies for NC or C/EBPβ knockdown HL-60 cells that had been transduced with control or JMJD3-overexpressing vector. m 32D cell lysates were immunoprecipitated with Jmjd3 antibody and subsequently subjected to western blot with Jmjd3, C/ebpα or C/ebpβ antibody: IgG served as negative IP control. n Heatmap representation of C/ebpβ and Jmjd3 tag density centered on C/ebpβ ChIP-seq peaks in 32D cells. Data are shown as the mean ± SEM; *p < 0.05, **p < 0.01, ***p < 0.001

