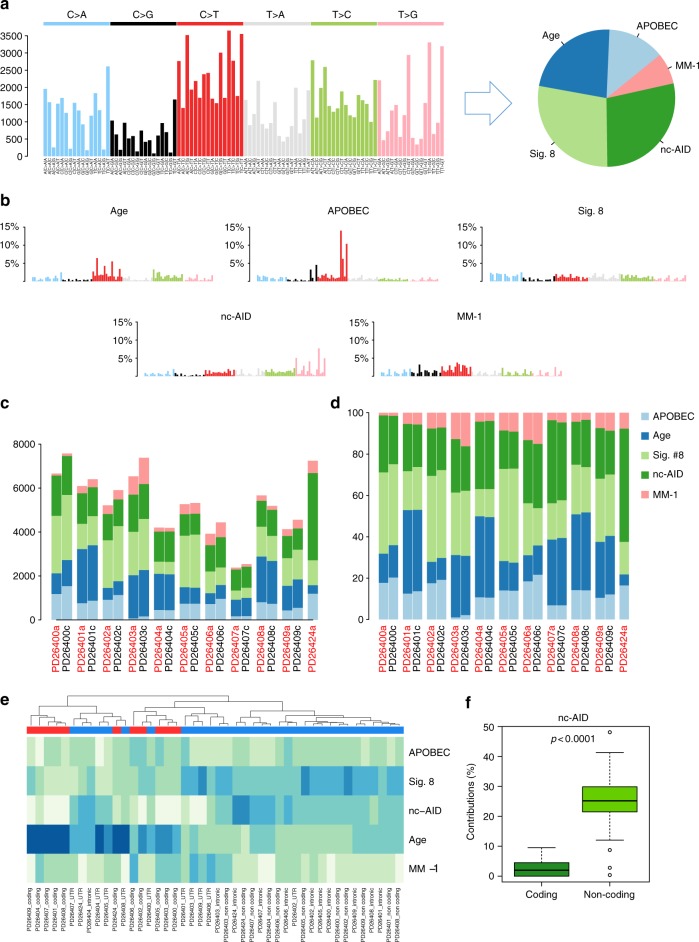
Fig. 4.
The landscape of mutational signatures involved in MM. a The 96-substitution class prevalence in all samples in the study from which NNMF extracted five main processes. b Representation of the five processes extracted by NNMF. c, d Barplots representing the absolute (c) and the relative (d) contribution of each mutational signature for each sample. e Hierarchical clustering based on the relative contribution of each mutational signature in each patient, according to the coding or noncoding status of each mutation. f Boxplot showing a strong association between nc-AID process and noncoding mutations. The p value was extracted by Wilcoxon test (wilcox.test R function). The whiskers are proportional to the interquartile range and are plotted with default parameters using the boxplot.stats R function

