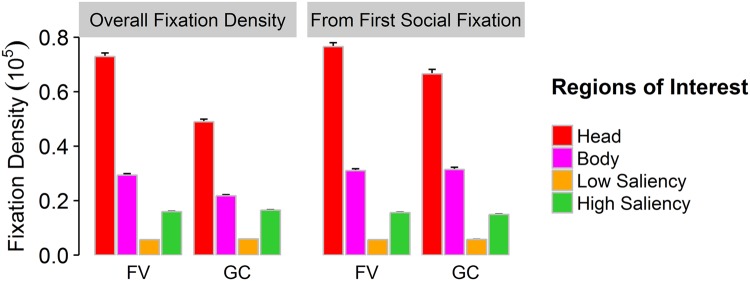
Figure 2.
Relative area-normed fixation density on regions of interest (ROIs) for free-viewing (FV) and gaze-contingent (GC) viewing. The left panel depicts the overall fixation densities for the presentation duration of 10 s. The right panel shows fixation densities measured from the time point in which the participants first fixated a social feature until the end of the presentation time of 10 s. Error bars represent standard errors of the mean.

