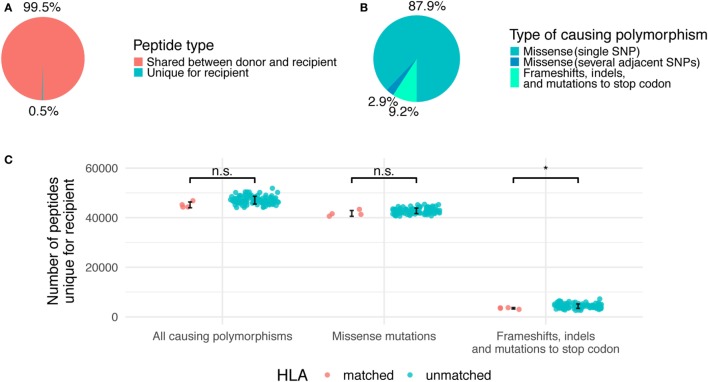
Figure 2.
Relative contribution of different genetic polymorphisms to unique recipient peptidome. (A) The fraction of total recipient’s peptidome occupied by unique recipient peptides (URPs). (B) The share of URPs encoded by different polymorphisms. (C) Absolute numbers of URPs in all analyzed pairs, HLA-matched and unmatched pairs are shown separately. Error bars mark one SD from the mean. Significance of two-tailed t-test for comparison of the two groups is shown as follows: p < 0.05 (*), n.s, non significant.

