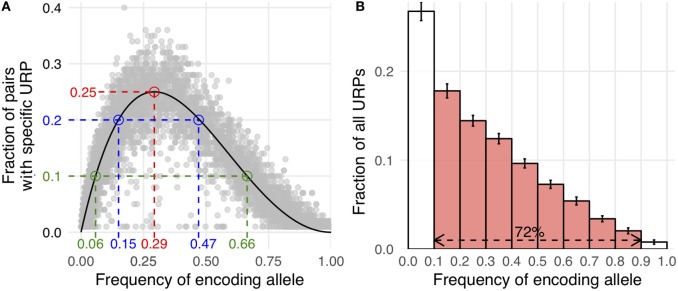
Figure 3.
Correlation of allele frequency and unique recipient peptides (URP) occurrence. (A) Allele frequency of encoding polymorphism is plotted against the fraction of pairs in which this particular URP was found (random selection of 10,000 URPs is shown). Theoretical curve calculated by the formula provided in the text is shown in black. Red dashed line indicates the peak at which Pmm (probability of minor histocompatibility antigen mismatch) reaches 25%. Blue and green lines delineate allele frequency range yielding Pmm ≥ 20 and 10%, respectively. (B) The distribution of nonsynonymous polymorphism-encoded URPs by the frequency of encoding allele. The data were averaged among all considered pairs, error bars show one SD. The red fill indicates the fraction of URPs encoded by the alleles relatively frequent in the population (0.1 < MAF < 0.9).

