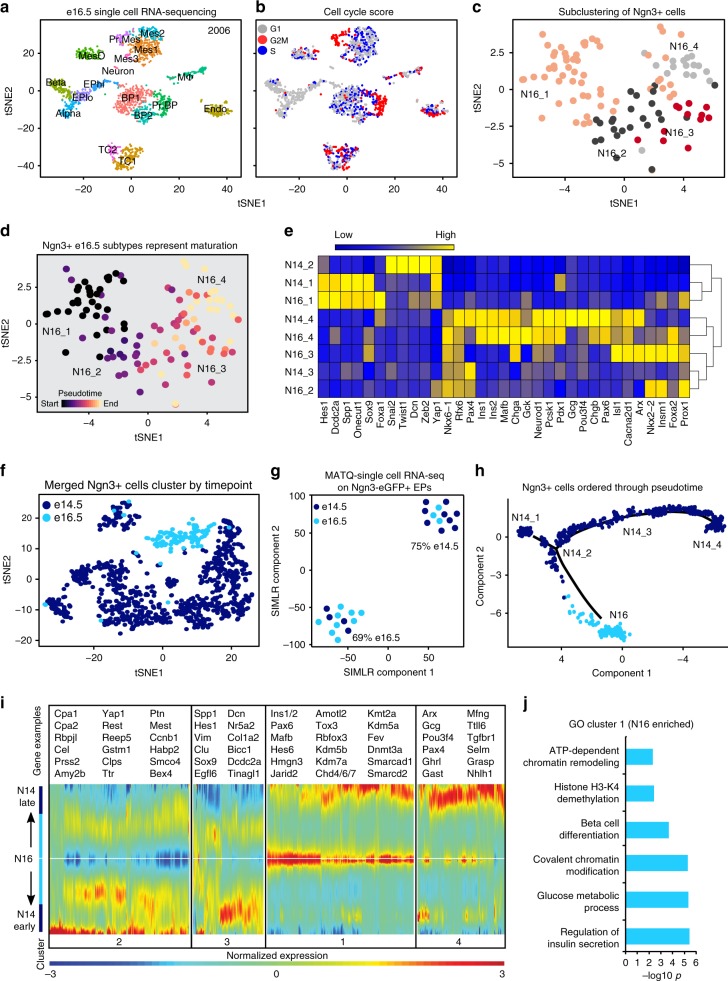
Fig. 4.
Ngn3 + cells at e14.5 are distinct from Ngn3 + cells at e16.5. a tSNE representation of 2006 single-cell transcriptomes from 21 e16.5 pancreata from two litters. Cell types are annotated from gene expression profile. Colors indicate cluster identity. Mes mesenchyme, MesO mesothelium, EPhi EPs with high Ngn3, BP bipotent progenitors, EPlo EPs with low Ngn3, MΦ macrophages, Endo endothelial cells. b Cell cycle phase analysis of single embryonic pancreatic cells. The approximate cell cycle phase was calculated by scoring individual cells on their expression for S-phase genes, G1 genes, and G2M transition genes as defined by Kowalczyk et al.31. c An enhanced view shows four subpopulations of Ngn3 + cells at e16.5. Subclustering of Ngn3 + cells visualized using tSNE. Colors indicate cluster identity. d Ngn3 + cell subtypes belong to different temporal groups. Pseudotemporal ordering of single cells revealed the developmental trajectory as N16_1, N16_2, N16_3, then N16_4. e Log2 z-score normalized heatmap showing expression of key EP genes (x-axis) in EP subtypes (y-axis). Expression ranges from blue (low) to high (yellow). f Single Ngn3+cell transcriptomes merged for unsupervised clustering and visualization by tSNE. E14.5 Ngn3 + cells (dark blue) cluster separately from e16.5 Ngn3 + cells (light blue). g MATQ-seq shows the majority of e14.5 and e16.5 single cells cluster into temporally restricted groups. SIMLR component analysis of single Ngn3-eGFP EPs from e14.5 and e16.5 from two batches. E14.5 cells are shown in dark blue while e16.5 cells are shown in light blue. p < 0.05 by Fisher’s exact test. h E14.5 and e16.5 Ngn3 + cells are transcriptionally distinct. Ordering of merged e14.5 and e16.5 single Ngn3 + cells shows a divergence of e16.5 Ngn3 + cells from e14.5. i Branched expression analysis modeling showing transcriptional differences between e16.5 Ngn3 + cells (N16) and N14_1 or N14_4. Examples of genes from each cluster are shown to the right, including enrichment of tip markers in N14_1, alpha cell genes in N14_4, and beta cell genes in N16. j Gene ontology analysis of genes enriched in e16.5 Ngn3 + cells compared to e14.5 Ngn3 + cells (kinetic cluster 1). See also Supplementary Figures 8, and 11-14

