Fig. 8.
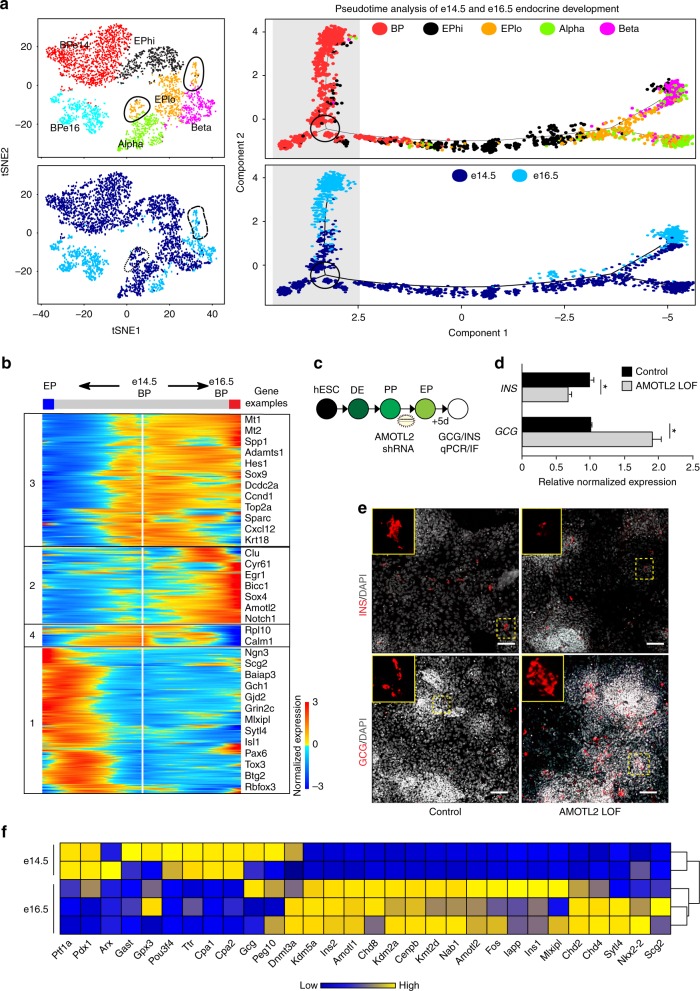
Bipotent progenitors change with more alpha and tip cell genes expressed at e14.5 and more beta cell genes expressed at e16.5. a Pseudotemporal ordering of merged e14.5 and e16.5 single cells revealing the developmental trajectory of BPs as they differentiate. On left, tSNE plot of merged e14.5 and e16.5 single cells in clusters (top) and with original identities (bottom). On right, BPs branch depending on developmental stage of origin, with e14.5 BPs making a choice between maturation into e16.5 BPs or differentiation into endocrine cells (clusters on top; original identities on bottom). b Branched expression analysis modeling (BEAM) showing transcriptional kinetics as e14.5 BPs either mature to e16.5 BPs or differentiate into EP, alpha, or beta cells. Examples of genes from each cluster are shown to the right, including Dcdc2a, which is conserved in both e14.5 and e16.5 BPs, and Amotl2, which is increasing as e14.5 BPs mature into e16.5 BPs. c Schematic for AMOTL2 knockdown in hESC-derived EPs. Lentivirus with pGIPZ AMOTL2 shRNA was transduced into hESCs at day 0 of the EP stage and cells were collected for analysis after 5 days in basic DMEM/B27 media. d AMOTL2-LOF cells resemble the e14.5 phenotype, with more GCG and less INS. qPCRs showing INS and GCG expression 5 days after loss of AMOTL2 in hESC-derived EPs. Samples are normalized to TBP. N = 3 biological replicates. Scale bars are SEM, *p < 0.05 by Student’s t-test. e Immunostaining of INS, GCG, and CHGA in control and AMOTL2-LOF hESC-derived EPs. Scale bar = 100 μm. f Average cluster log2 z-score normalized heatmap of select beta, alpha, and tip cell markers in e14.5 and e16.5 BPs. See also Supplementary Figure 17

