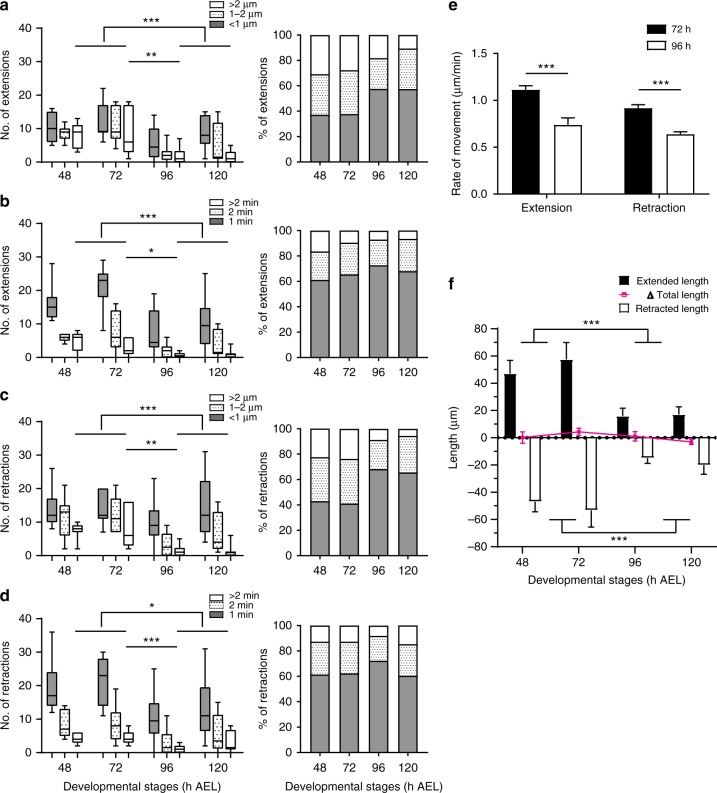
Fig. 2.
LNv dendrites change from dynamic to stable during development. a, b At all stages, most extensions are within 2 μm or lasted less than 2 min. More extension events that last longer than 2 min or travel further than 2 μm were observed in young neurons as compared to mature neurons. Distributions of distance and duration are shown. c, d Retractions behave similarly as extensions. Statistical significance was assessed by two-tailed Student’s t-test for extensions/retractions with distance more than 2 μm or duration more than 2 min. a P < 0.001, 2nd vs 3rd instar; P = 0.008, 72 vs 96 h. b P < 0.001, 2nd vs 3rd instar; P = 0.018, 72 vs 96 h. c P < 0.001, 2nd vs 3rd instar; P = 0.004, 72 vs 96 h. d P = 0.011, 2nd vs 3rd instar; P = 0.001, 72 vs 96 h. e Dendrites in young LNvs (72 h) extend and retract faster than the ones in mature LNvs (96 h). Statistical significance was assessed by sum-of-squares F test of slopes generated by linear fitting of the distance vs. duration. For extension: slope is 1.113 ± 0.044 for 72 h, and 0.738 ± 0.075 for 96 h. For retraction: slope is −0.917 ± 0.037 for 72 h, and −0.639 ± 0.025 for 96 h; P < 0.001 for both comparisons. n = 11, 72 h; n = 13, 96 h. f Cumulatively, young neurons (48 and 72 h) extend and retract significantly more than mature neurons (96 and 120 h), without affecting the total dendritic length. Statistical significance was assessed by two-tailed Student’s t-test. Extended length: P < 0.001; retracted length: P < 0.001. n = 7, 7, 10, and 8 for 48, 72, 96, and 120 h, respectively, for a–d, and f. Data are presented as box plot (box, 25–75%; center line, median) for a–d; Bar heights are means and error bars are SEM in e–f; ns, not significant; *P < 0.05, **P < 0.01, ***P < 0.001

