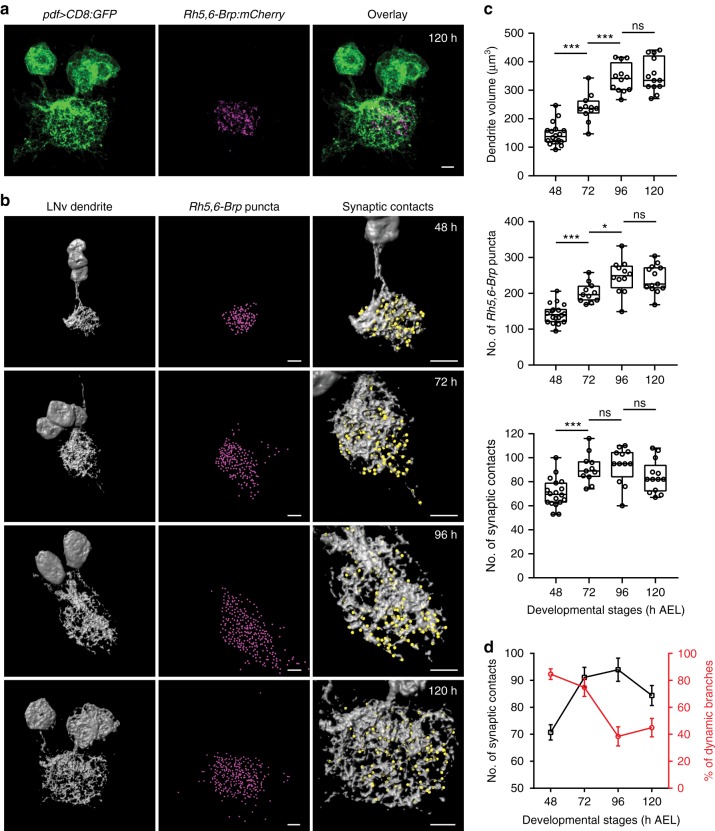
Fig. 3.
Temporal coupling of dendrite dynamics with synaptogenesis in LNvs. a Representative projected confocal images of the LNv dendrite (green) co-labeled with Rh5,6-Brp:mCherry (magenta). Scale bar, 5 μm. b The LNv dendrite volume (gray), the number of presynaptic terminals from the BN in the LON region (Rh5,6-Brp puncta, magenta spots) and the number of Brp puncta contacting the LNv dendrites (synaptic contacts, yellow spots) were analyzed using 3D reconstructions. Representative images for samples collected at the indicated time points are shown. Scale bar, 5 μm. c LNv dendrite volume (Top) increases during development until 96 h; Rh5,6-Brp puncta (Middle) shows similar trend and plateaus at 96 h; The number of synaptic contacts (Bottom) increases significantly from 48 to 72 h, then remains steady. n = 18, 11, 12, and 13 for 48, 72, 96, and 120 h, respectively. Statistical significance was assessed by one-way ANOVA followed by Tukey’s post hoc test. Volume (Top), ANOVA: F3, 50 = 60.19, P < 0.001; Tukey’s: P < 0.001, 48 vs 72 h and 72 vs 96 h; P = 0.949, 96 vs 120 h. Rh5,6-Brp puncta (Middle), ANOVA: F3, 50 = 30.03, P < 0.001; Tukey’s: P < 0.001, 48 vs 72 h; P = 0.015, 72 vs 96 h; P = 0.963, 96 vs 120 h. Synaptic contacts (Bottom), ANOVA: F3, 50 = 9.465, P < 0.001; Tukey’s: P = 0.001, 48 vs 72 h; P = 0.955, 72 vs 96 h; P = 0.278, 96 vs 120 h. Data are presented as box plot (box, 25–75%; center line, median) overlaid with dot plot (individual data points). ns, not significant; *P < 0.05, ***P < 0.001. d The number of synaptic contacts (black) reaches saturation at 72 h, coinciding with the peak of LNv dendrite dynamics (red). Trend lines were generated using data from Figs. 1c, 3c. Error bars represent SEMs

