Fig. 8.
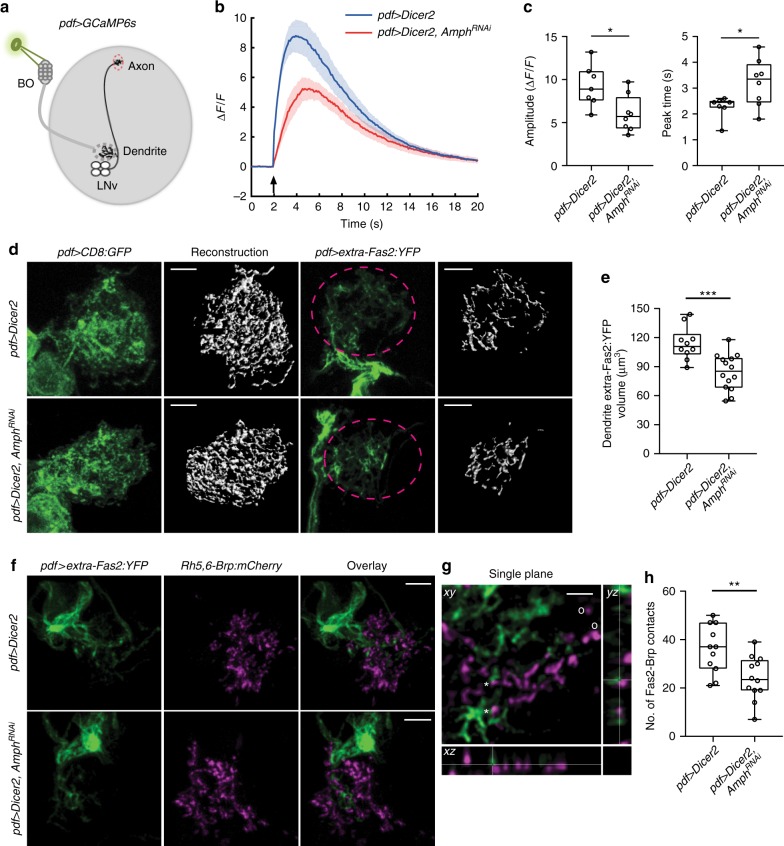
Amph is required for postsynaptic organization and normal synaptic transmission. a Schematic diagram for calcium imaging experiments. BO-mediated synaptic transmission is received by LNv dendrites (dashed gray circle) and measured by the changes of GCaMP6s signals in the axonal terminal region of LNvs (dashed red circle). b Knocking-down Amph led to reductions in light-induced responses in LNvs. The changes in GCaMP signal (ΔF/F) were plotted. Data are presented as line graph showing Mean ± SEM. Arrow indicates the delivery of the light stimulation. c Quantification reveals reduced amplitude and delayed peak time of calcium responses in LNvs expressing Amph RNAi. n = 7, pdf > Dicer2; n = 8, pdf > Dicer2, AmphRNAi. Statistical significance was assessed by two-tailed Student’s t-test. Amplitude: t13 = 2.742, P = 0.017. Peak time: t13 = 2.491, P = 0.027. d Disrupted dendritic Fas2 distribution in LNvs expressing Amph RNAi. While CD8:GFP (pdf > CD8:GFP, left) shows no change, the volume of dendritic extra-Fas2:YFP (pdf > extra-Fas2:YFP, right) is reduced in LNvs with Amph knockdown. Representative projected confocal images (green) and 3D reconstructions (gray) are shown. Scale bar, 5 μm. e Quantification of dendritic extra-Fas2:YFP based on 3D reconstructions. n = 10, pdf > Dicer2; n = 14, pdf > Dicer2, AmphRNAi. Statistical significance was assessed by two-tailed unpaired Student’s t-test. t22 = 3.969, P < 0.001. f–h Amph knockdown reduces the synaptic distribution of Fas2. f Representative projected confocal images of LNvs are shown. Scale bar, 5 μm. Genotypes are as indicated. g A representative single optic section image illustrating the dendritic Fas2 (extra-Fas2:YFP, green) contacting the presynaptic site marked by Brp (Rh5,6-Brp, magenta). Contacts are indicated by *, non-contacts by o. Scale bar, 2 μm. h Quantifications of the number of contacts between Brp puncta and extra-Fas2:YFP. Knocking-down Amph led to reduced number of Fas2-Brp contacts. n = 11, pdf > Dicer2; n = 12, pdf > Dicer2, AmphRNAi. Statistical significance was assessed by two-tailed Student’s t-test. t21 = 2.988, P = 0.007. Data are presented as box plot (box, 25–75%; center line, median) overlaid with dot plot (individual data points). ns, not significant; *P < 0.05, **P < 0.01, ***P < 0.001

