Figure 8.
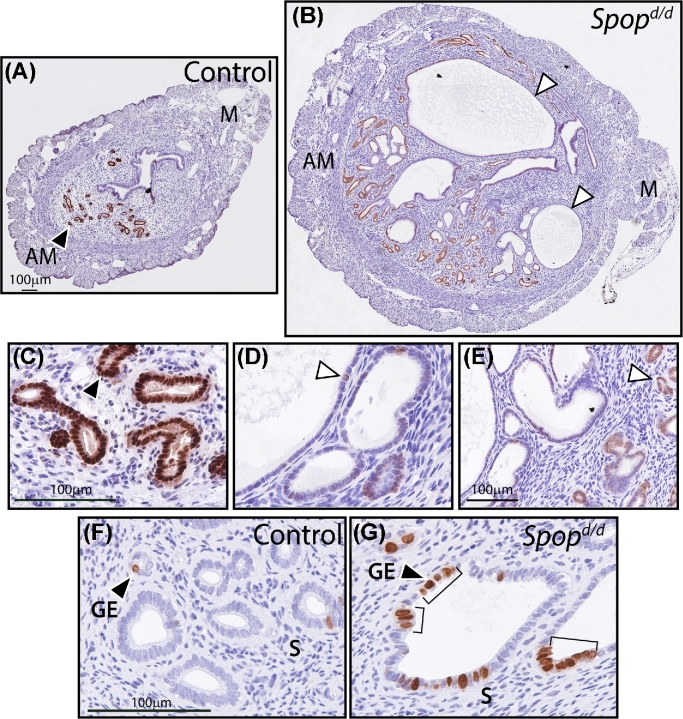
Epithelial cells in Spopd/d endometrial cysts express low levels of FOXA2 and exhibit increased proliferative capacity. (A) Transverse section of uterine horn from a control mouse stained for FOXA2 expression. Note the expected strong immunopositivity for FOXA2 expression in the glandular epithelia located in the antimesometrial (AM) pole (arrowhead); M indicates mesometrial pole. (B) Transverse section of uterine horn from Spopd/d mouse similarly stained for FOXA2 expression. Note the significant decreased expression of FOXA2 in the larger cystoid structures (arrowheads). Scale bar in (A) applies to (B). (C) Higher magnification of region shown in (A) above. (D) and (E) are higher magnifications of regions shown in (B) above. Scale bar in (C) applies to (D). (F) Control glandular epithelia (GE) stained for BrdU incorporation. Note the sparse distribution of BrdU-positive GE cells (arrowhead). (G) Immunostaining for BrdU incorporation in Spopd/d GE cells. Note the foci (brackets) of BrdU-positive cells in the larger cystic glands; S indicates stroma. Scale bar in (F) applies to (G).

