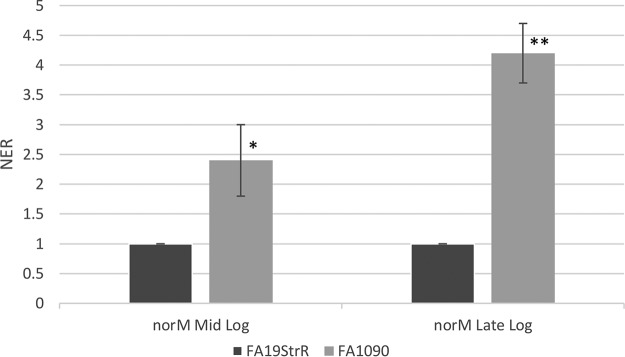
FIG 2.
Quantitative RT-PCR results with norM in strains FA19StrR and strain FA1090 at the mid-logarithmic and late logarithmic phases of growth. Error bars represent SDs from the means of 3 independent experiments. Normalized expression ratios (NER) were calculated using 16S rRNA expression. *, P = 0.018; **, P = 0.004 (for comparison of values of FA1090 versus FA19StrR). The statistical significance was determined by Student's t test.

