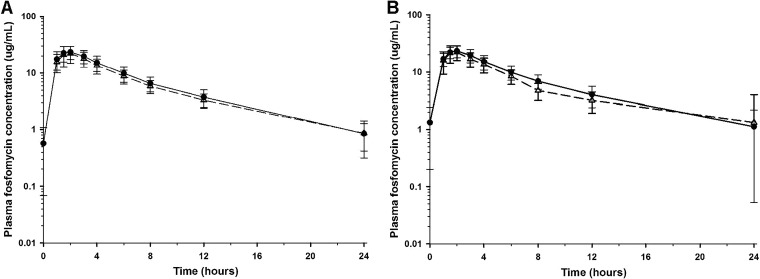
FIG 1.
Mean (± SD) concentration-versus-time profiles of fosfomycin in plasma after oral administration of 3 g oral fosfomycin tromethamine on study day 1 (A) and study day 5 (B). The QOD dosing regimen data are illustrated by open triangles and a dashed line, and the QD regimen data are illustrated by filled circles and a solid line. The y axis is on a log scale.

