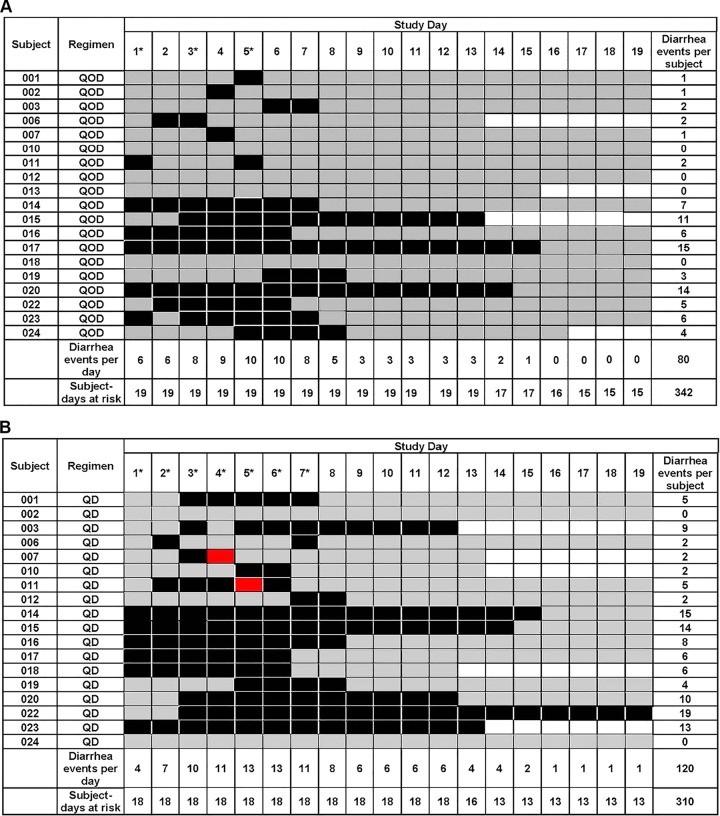
FIG 4.
Days of diarrhea per subject and study day during the QOD regimen (A) and the QD regimen (B). Cases of CTCAE grade 1 diarrhea are shaded in black, and cases of grade 2 diarrhea are shown in red. Gray shaded days indicate that no diarrhea events occurred during these at-risk days. Unshaded days represent days beyond a participant's follow-up period. Asterisks represent days of study drug administration.

