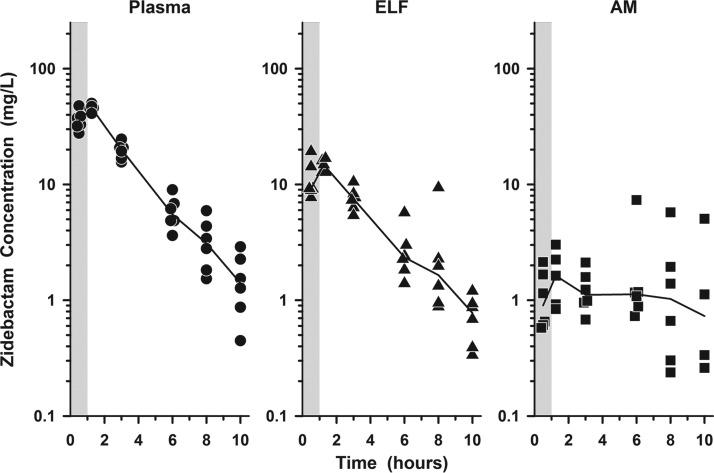
FIG 3.
Individual concentrations of zidebactam in plasma (circles), ELF (triangles), and AM (squares) at 0.5, 1.25, 3, 6, 8, and 10 h after the seventh dose of WCK 5222 (2 g cefepime/1 g zidebactam) administered as a 1-h intravenous infusion every 8 h. The lines represent the median concentrations. The shaded regions represent the 1-h infusion period. The y axes are in log scale.

